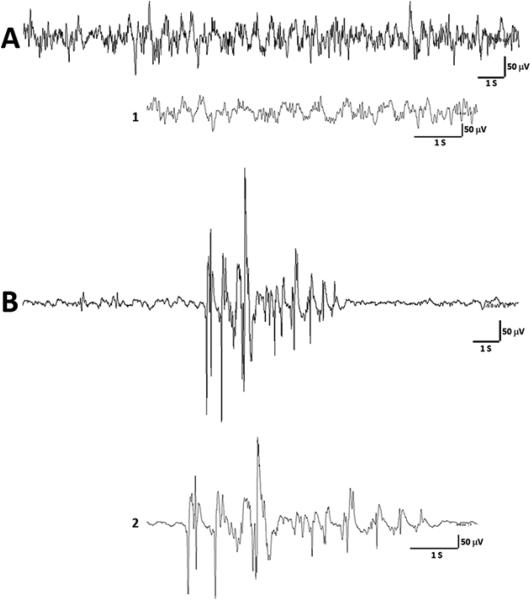
Figure 4.
Representative EEG tracings from a P10 rat injected with flupirtine. (A) The tracing shows baseline EEG obtained before the rat was injected with a drug and exposed to hypoxia. A magnified trace of EEG (1) is provided under the compact EEG tracing for a better clarity. (B) The EEG shows a burst suppression-like pattern following flupirtine (35 mg/kg) treatment that appeared before the rat was exposed to hypoxia. The EEG trace at the slower time scale (2) provides a magnified view of the burst suppression-like pattern. S = second, V = volts.

