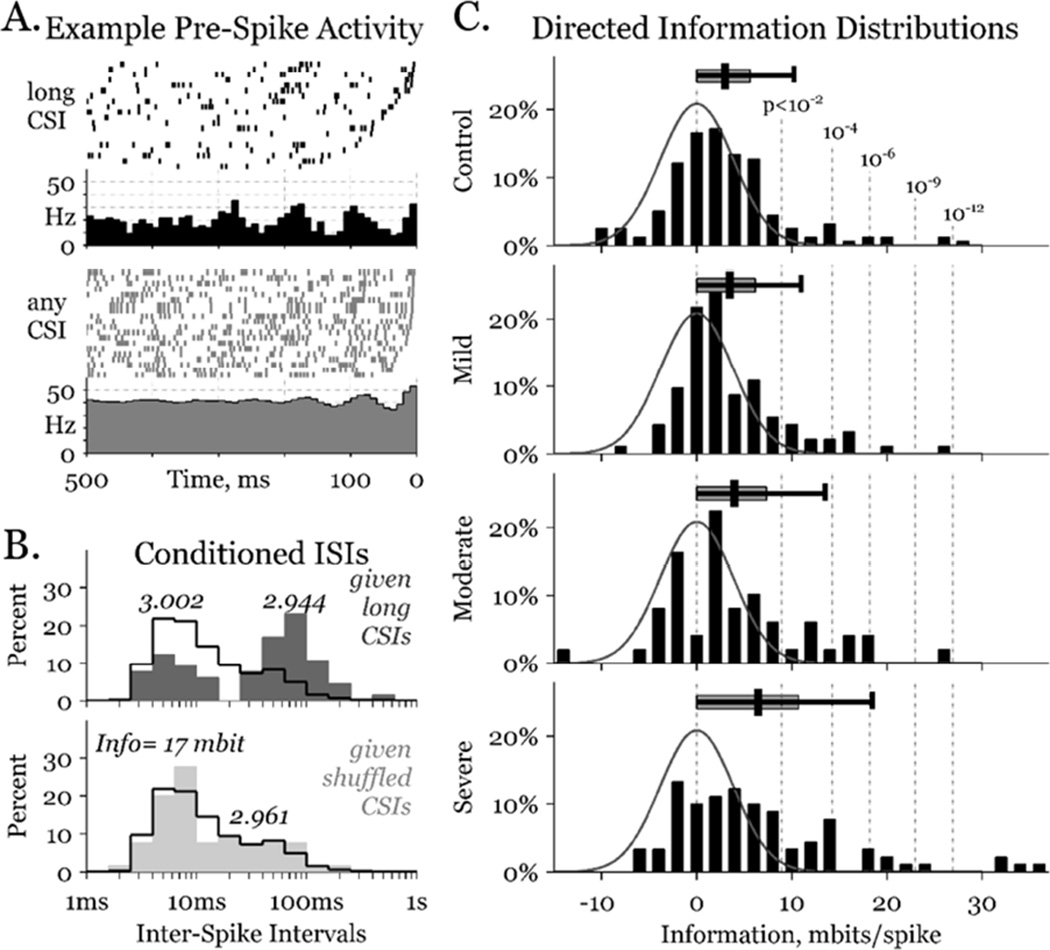
Figure 2.
Neuronal information estimates. A) Rastergrams (above) of twenty 0.5 s intervals aligned to a spike at time zero in one GPi cell, when the most recent spike in a particular GPe cell (i.e., the CSI) was 4.0–6.3 s ago (black) or chosen at random (grey). Rate histograms (below) show periodicity lasting 2–3 times longer in the long CSI case. B) ISI distributions in the long CSI (above, dark grey) and a shuffled CSI (below, light grey) cases, overlying the unconditioned distributions (black outlines). The bimodal distribution in the long CSI case carries substantial information about the CSI. Numbers above each distribution peak denote the entropy of that distribution. C) Information distributions (black bars) of all pairs – including GPe-GPe, GPe-GPi, GPi-GPe, and GPi-GPi – in each parkinsonian condition. Gaussian curves (grey line) depict the expected distribution in the truly independent, zero-information case, and are identical on all 4 graphs. Vertical dashed lines identify the probability of a given pair exceeding the corresponding information, in the zero information case. Overhanging distribution bars starts at zero, and show the median, 75th and 95th percentile distribution interval for each condition.

