Figure 3.

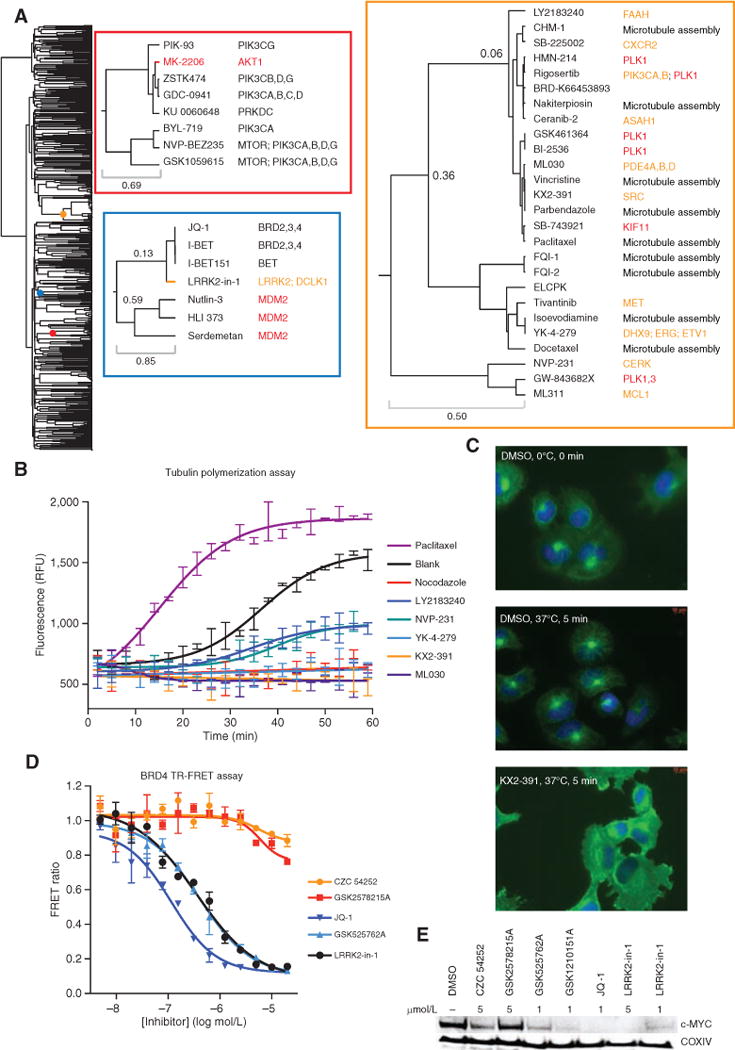
ACME analysis sheds light on small-molecule mechanism of action. A, dendrogram of the small-molecule Informer Set. Colored dots on the dendrogram denote the location of the enlarged dendrogram segments displayed to the right (color-coded to boxes). The top left inset (red box) is a “zoom in” of the cluster enriched for PI3K signaling, and the bottom left inset (blue box) contains one cluster enriched for MDM2 and one enriched for bromodomain inhibitors. The right inset (orange box) is the antimitotic cluster discussed in the text. For this inset, protein targets are colored by class: inhibitors of microtubule assembly (black), antimitotic kinase inhibitors with targets other than tubulin (red), and compounds with nominal protein targets unrelated to microtubule assembly or mitotic kinases (orange). B, recombinant tubulin polymerization assay. Every third data point is displayed. Each compound was run in duplicate (paclitaxel, 3 μmol/L; nocodazole, 3 μmol/L; KX2-391, 10 μmol/L; YK-4-279, 10 μmol/L; NVP-231, 10 μmol/L; LY2183240, 10 μmol/L). RFU, relative fluorescence units. C, microtubule regrowth assay in NCIH661 cells. Cells were cooled for 30 minutes on ice prior to compound treatment at time 0, and cells were either fixed directly or warmed to 37°C for 5 minutes and then fixed, followed by immunostaining for nucleus/DNA Hoechst stain (blue) and α-tubulin (green). All compounds were used at 500 nmol/L. D, BRD4 bromodomains 1 and 2 time-resolved FRET assay. E, Western blot of lysates from MM1S cells treated for 6 hours with compound at the indicated concentrations.
