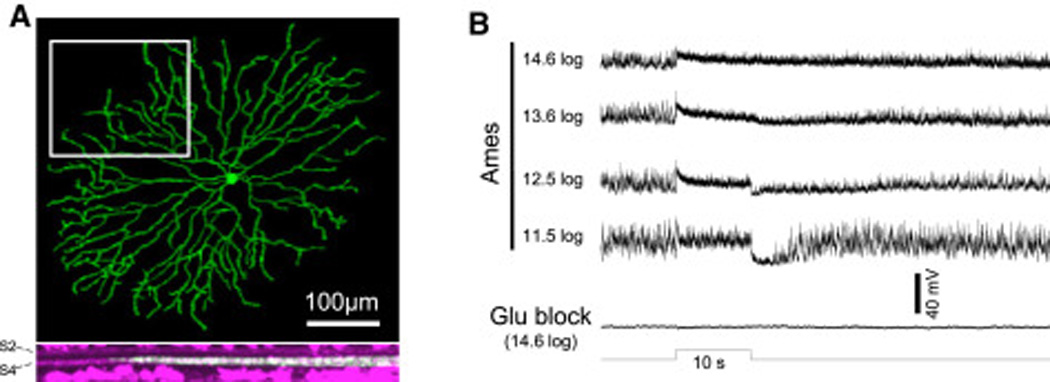
Figure 1. Non-spiking, sustained ON amacrine cells lost photosensitivity during rod/cone signaling block.

A) The Lucifer Yellow fill of one such neuron, which was a starburst cell. Top: Confocal z-projection. Bottom: The rotated view of the region highlighted by the rectangle in the top panel. The magenta staining represents ChAT labeling, which marks S2 and S4 of the IPL. B) Light responses from another non-spiking sustained amacrine cell, recorded during superfusion by normal Ames’ medium (top recordings) and after the addition of 50 µM L-AP4, 40 µM DNQX and 25 µM D-AP5 (“glutamate blockers”) to disrupt rod/cone signaling (bottom recording). The log values indicate light intensity in photons cm−2 s−1.
