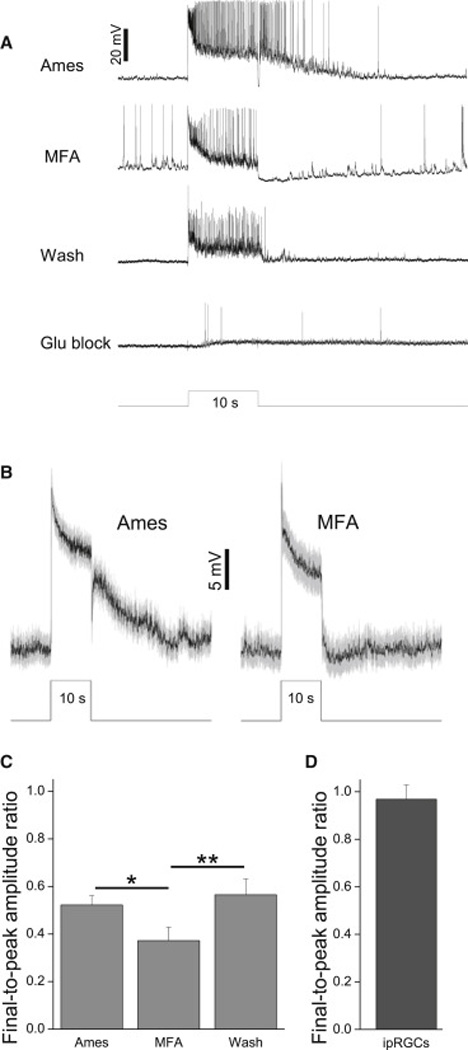
Figure 7. Rod/cone input to ipRGC-driven displaced amacrine cells is tonic.

A) A monostratified amacrine cell’s light responses remained sustained during disruption of ipRGC input by MFA. At the end of this experiment, this cell was confirmed to be ipRGC-driven by its photosensitivity in the presence of glutamate blockers. B) Mean±S.E.M. of all 20 cells tested (11 monostratified, 5 bistratified, 4 polyaxonal). C) The final-to-peak photoresponse amplitude ratio measured under three superfusion conditions. *, p < 0.05; **, p < 0.01. D) The averaged final-topeak photoresponse amplitude ratio measured from 45 ipRGCs (6 M1, 12 M2, 4 M3, 13 M4 and 10 M5) during superfusion with normal Ames’ (ref. [11]). Stimulus intensity was 13.6 log photons cm−2 s−1 in all panels.
