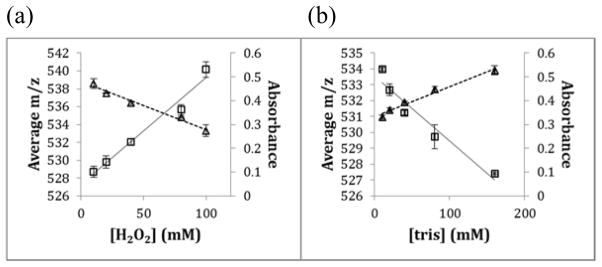
Figure 2. Relationship between angiotensin oxidation and adenine dosimetry.

(a) Standard angiotensin Sample with addition of adenine photolyzed in varying concentration of Hydrogen Peroxide. Squares, left y-axis - The centroid mass of oxidized and unoxidized angiotensin, 2+ charge state, with varying concentrations of hydrogen peroxide (10, 20, 40, 80, 100 mM); Triangles, right y-axis - Dose response curve between hydrogen peroxide concentrations and adenine UV reading. (b) Standard Angiotensin Sample with addition of adenine photolyzed in varying concentration of tris-HCl buffer. Square marker - The centroid mass of oxidized and unoxidized angtension, 2+ charge state, with varying concentrations of tris-HCl buffer (10, 20, 40, 80, 160 mM); Triangle marker - Dose response curve between tris-HCl buffer concentrations and adenine UV reading.
