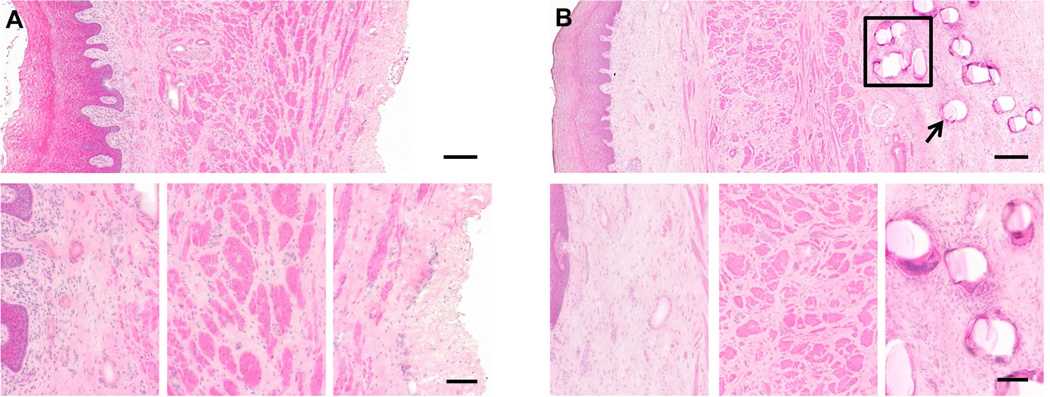
Figure 1.
Representative histologic section (hematoxylin and eosin) taken from Sham (A) and Gynemesh (B) groups. The top panel contains a full view of the histologic section at 10× magnification (scale bar = 250 µm). Bottom panel shows higher magnification images of the subepithelial connective tissues, muscularis layer and the adventitia (A) or mesh-tissue interface (B) (20× magnification, scale bar = 100 µm). The histomorphologic appearance of the response to Gynemesh was characteristic of the response observed in all mesh implanted groups. A dense population of mononuclear and multinucleated giant cells can be observed at the mesh-tissue interface, decreasing in number with increasing distance from the mesh surface. Box in (B) indicates a mesh knot, and arrow indicates a mesh fiber.

