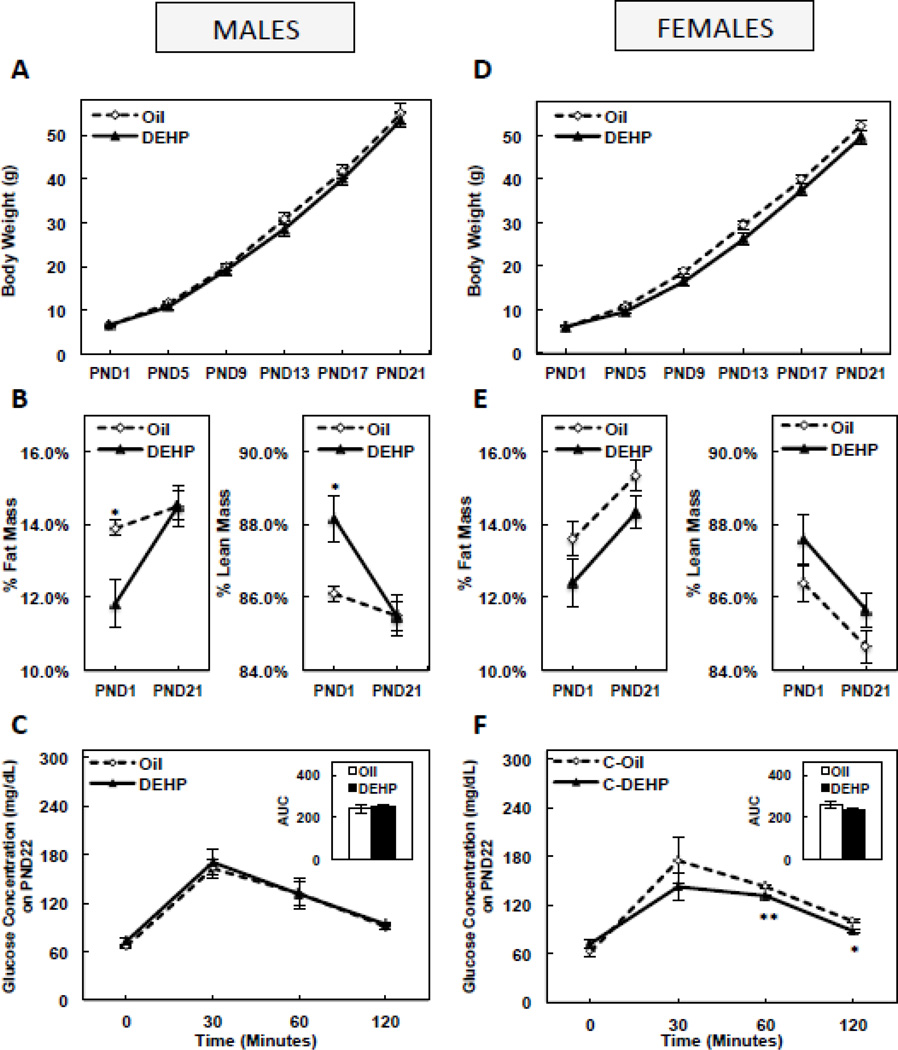
FIGURE 1. Body weight from postnatal day (PND) 1 until PND21 in male (A) and female (D) offspring, fat mass or lean mass on PND1 and PND21 in male (B) and female (E) offspring, and oral glucose tolerance and glucose area under the curve (AUC) on PND 22 in male (C) and female (F) offspring.
Offspring were exposed to maternal DEHP or vehicle (oil). Values are means ± SEM. n=5 male or female offspring. *P<0.05 and **P<0.005.

