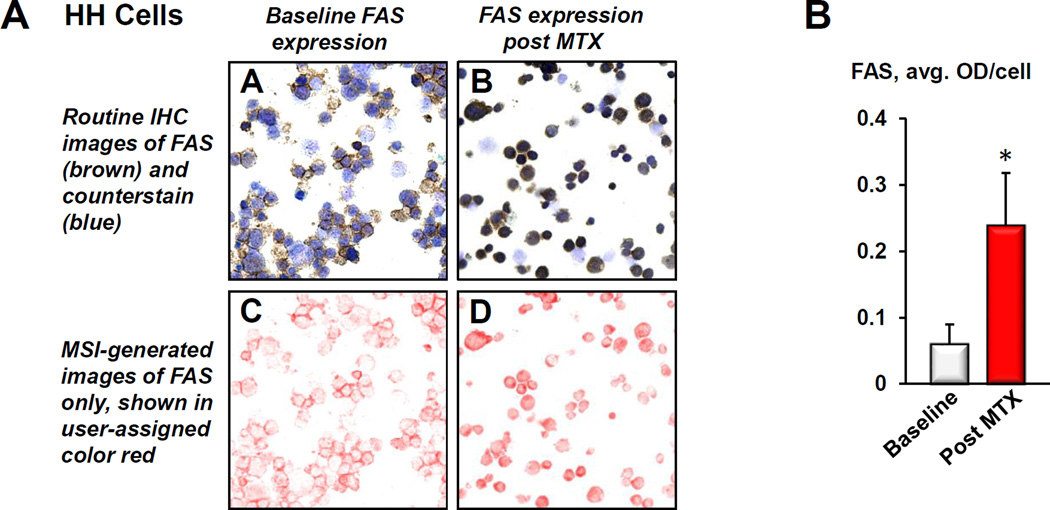
Figure 2.
A) Example of protein quantitation using multispectral imaging. A and B: Routine immunohistochemical (IHC) images of prototypical FAS-low HH cells stained for FAS before (baseline) and after treatment with MTX. The brown chromogen represents FAS, whereas the blue stain visualizes cell nuclei. C and D: MIA-systems allow to unmix routine IHC images into individual components. Here, the color red was user-assigned to depict FAS expression, which is shown unmixed (without the blue counterstain) to visualize the full extent of the stain intensity. As outlined in detail in Materials and Methods, MIA-generated images are then used to quantitatively assess protein expression. B) The histogram demonstrates FAS increase in HH cells in response to MTX (*p < 0.01 as compared to untreated controls). The above described MIA-based quantitative assessment was used to generate all histograms shown in Figures 3–7.

