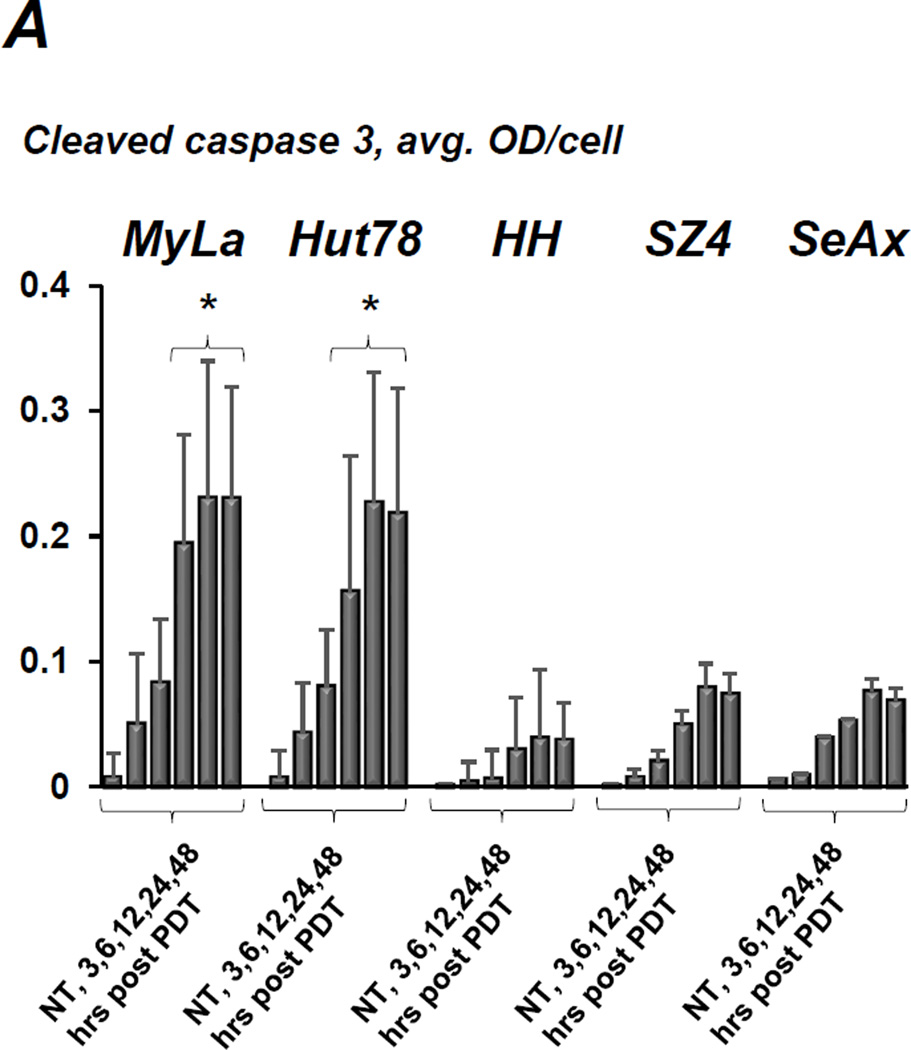
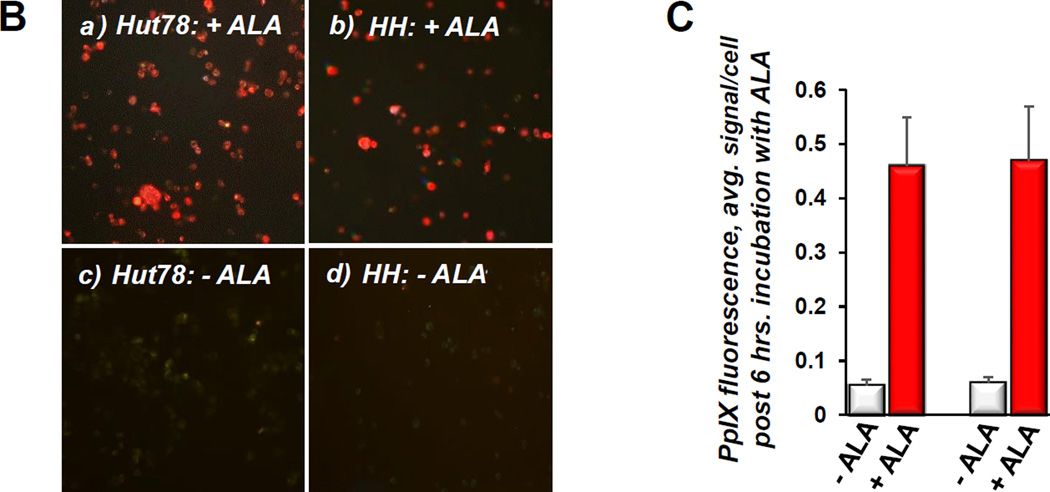
Figure 3.
A) Quantitative IHC using MIA of caspase 3 cleavage in CTCL cell lines following conventional ALA-PDT. Cells were collected at various time points post treatment, data for each cell line are shown as follows: untreated control, 3, 6, 12, 24 and 48 hours post PDT. *p < 0.01 as compared to caspase 3 activation in HH, SZ4 and SeAx cells. B) PpIX fluorescence (red) in prototypical FAS-high (a) and FAS-low (b) CTCL cell lines after incubation with ALA, c and d show respective untreated controls. C) The histogram shows quantitative MIA-based analysis of intracellular PpIX in Hut78 and HH cells before (− ALA) and after (+ ALA) incubation with 1mM ALA for 6 hours (*p < 0.01 as compared to untreated controls). All images and data shown in this as well as in the subsequent figures are representative of three separate experiments.


