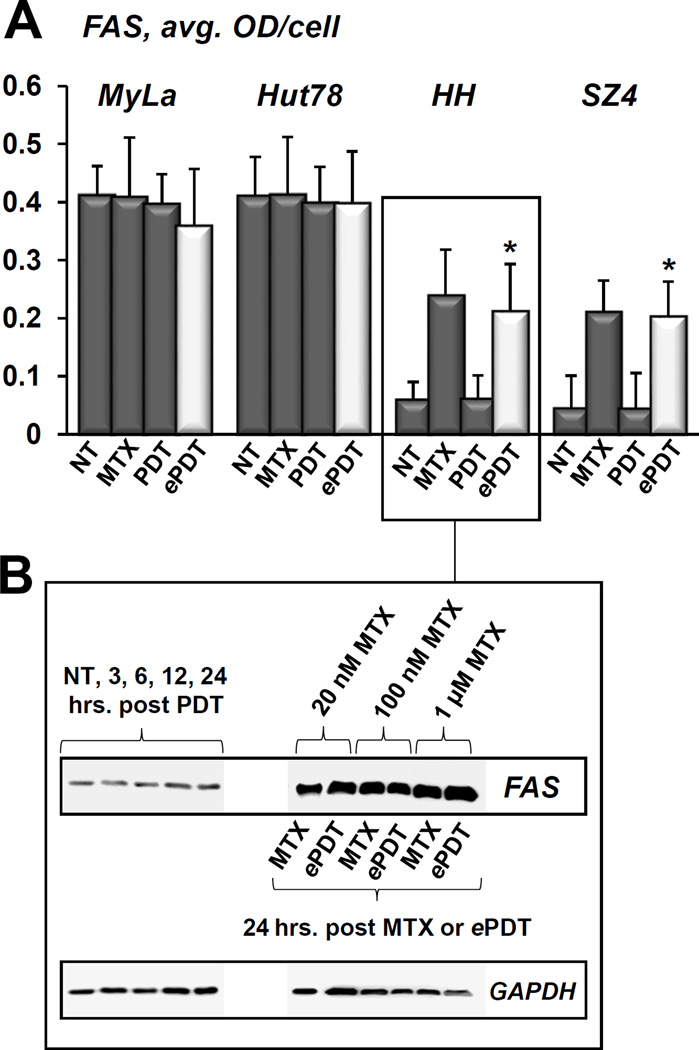
Figure 4.
FAS expression in CTCL cell lines in response to conventional ALA-PDT versus ePDT. A) Quantitative MIA-based assessment of FAS levels in MyLa, Hut78, HH and SZ4 (the FAS-null cell line SeAx was omitted from this experiment) in untreated controls (NT), cells post 48h incubation with 100 nM MTX, and cells 24 hours after conventional PDT versus ePDT. *p < 0.01 as compared to conventional PDT. B) Western blot analysis of FAS expression by HH cells following conventional PDT (lane 1: untreated controls, lanes 2–5: 3, 6, 12 and 24 hours post PDT) versus 24 hours after ePDT.

