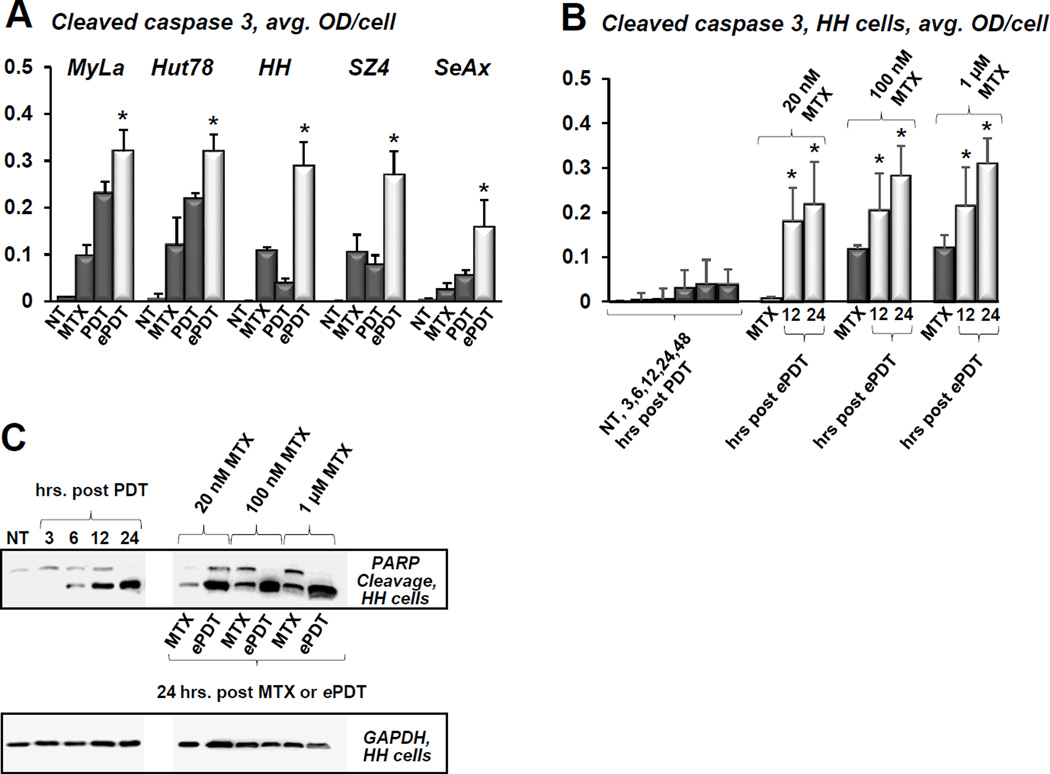
Figure 7.
A) Cleaved caspase 3 levels in CTCL cell lines as established by MIA, showing untreated controls (NT), status post 48h incubation with 100 nM MTX, and cells 24 hours after conventional PDT versus ePDT; *p < 0.01 as compared to conventional PDT. B) This panel shows caspase 3 cleavage in FAS-low HH cells after conventional PDT (1: untreated controls, 2–6: cells post conventional PDT at 3, 6, 12, 24 and 48 hours post irradiation) and ePDT using 20 nM, 100 nM and 1 μM MTX (1, 4, 7: MTX only controls; 2, 5, 8: cells 12 hours post ePDT: 3, 6, 9: cells 24 hours following ePDT). *p < 0.01 as compared to conventional PDT. C) Western blot analysis of PARP/cleaved PARP products in HH cells after PDT (lane 1: untreated controls, lanes 2–5: 3, 6, 12 and 24 hours post PDT) and ePDT (lanes 7, 9, 11: 20 nM, 100 nM, 1 μM MTX, respectively; lanes 6, 8 and 10 represent MTX only controls).

