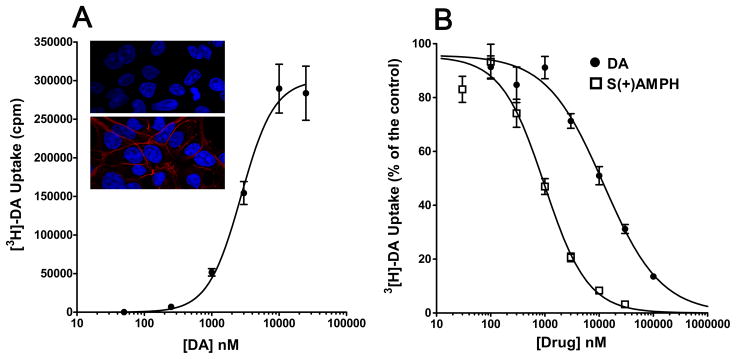
Figure 1. S(+)AMPH is more potent than DA as an hDAT substrate.

A. Confocal images show hDAT expression in Flp-hDAT cells (red stain in bottom panel) but not in parental Flp-InTm T-RExTM cells (top panel). DAPI nuclear staining is depicted in blue. Flp-hDAT cells show specific [3H] DA uptake with the following fitting parameters (see Eq. 1): EC50 = 2.73 ± 0.49 μM, Hill slope = 1.8 ± 0.5 (n = 18). B. Competition of [3H]DA uptake using cold dopamine or S(+)AMPH yielded the following fitting parameters (Eq. 1): IC50 = 12.05 ± 1.79 μM, Hill Slope = 0.8 ± 0.1 (n = 9) and IC50 = 0.98*** ± 0.12 μM, Hill slope = 1.1 ± 0.1 (n = 11, ***p < 0.001 vs. IC50 DA competition, t-test) for DA and S(+)AMPH, respectively.
