
Figure 3. Serial chest CT scans of 33-year-old male with lung adenocarcinoma harboring EGFR-KDD documenting response to afatinib and subsequent acquired resistance.
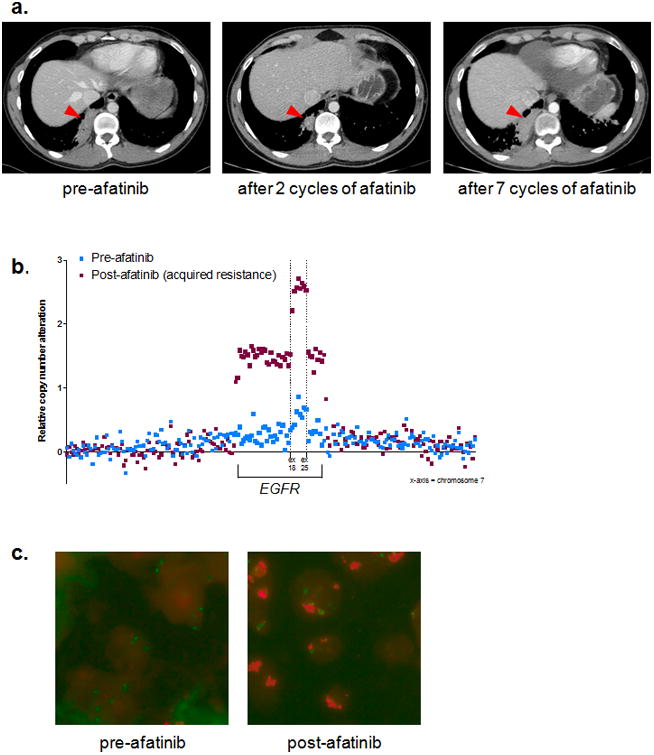
(a) Left image = patient images post six cycles of cisplatin/pemetrexed/bevacizumab (largest mass diameter = 6.62 cm). Middle image = patient images post two cycles of afatinib (largest mass diameter = 2.72 cm). Right image = patient images post seven cycles of afatinib (largest mass diameter = 6.20 cm). The red arrowheads are pointing to the largest mass used for RECIST evaluation. (b) Copy number data from Foundation One™ NGS targets along chromosome 7 demonstrating amplification of the EGFR-KDD allele at the time of acquired resistance to afatinib (maroon squares) compared to the pre-afatinib tumor biopsy sample (blue squares). The x-axis represents chromosome 7. (c) EGFR FISH of pre- (left panel) and post- (right panel) afatinib tumor biopsy samples used for the NGS analysis shown in panel b. Pre-afatinib = 1.6 copies of EGFR per chromosome 7 centromere (1.6 EGFR/CEP7); post afatinib = 4.2 EGFR/CEP7. Green puncta = CEP7; Red puncta = EGFR.