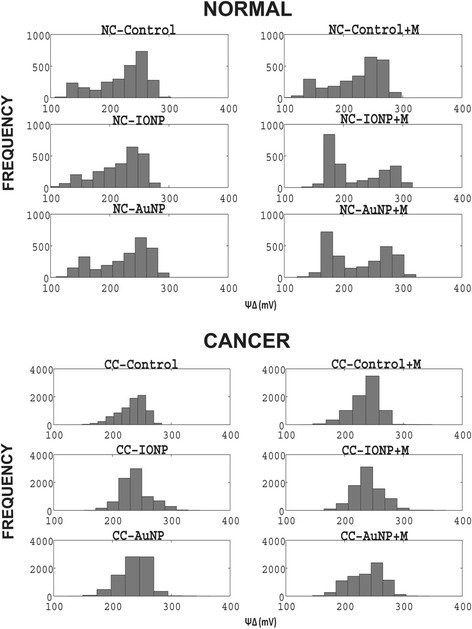
Figure 8.

Alteration of ΔΨ distribution in response to SMF and nanoparticle perturbation. Top panel compares the changes in ΔΨ distribution of normal cells in presence and absence of SMF. The title of each histogram is given in the figure. Similar panel is shown for cancer cells.
