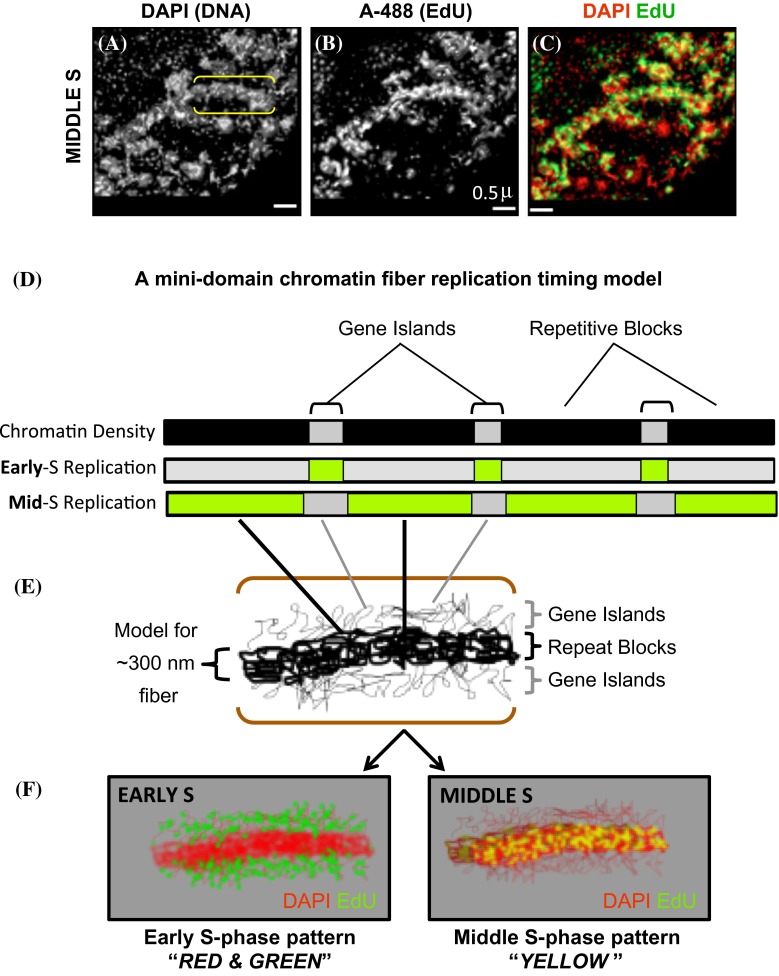
Fig. 6.
A mini-domain model for the maize DNA replication patterns during early versus middle S phase. a–c A small region from a SIM image of a nucleus in mitotic middle S phase is shown along the top after imaging the DAPI and EdU as described in Fig. 2. Yellow brackets indicate a “thick fiber” of approximately 300-nm width that can be seen in both wavelengths. d Schematic of genic regions (light gray) with alternating and larger repetitive blocks (black) are proposed to replicate during early (green sections in “Early S”) or middle (green sections in “Mid S”) S phase. e Hypothetical folding model in which the repetitive intergenic regions form the thicker most visible core of the 300-nm fiber, surrounded by less densely packaged chromatin (thin fibers above and below the 300-nm fiber) from the genic regions. f Diagram illustrating how the model in e would appear in our cytological assays of early (EARLY S) compared to middle (MIDDLE S) S phase. The organization depicted in e could appear as the “RED and GREEN” pattern of bulk chromatin seen in Early S (e.g. Figs. 2c, g, 4a, 5c, g), or the “YELLOW” pattern of bulk chromatin seen in Middle S (e.g. Figs. 2k, o, 4b, 5k, o)

