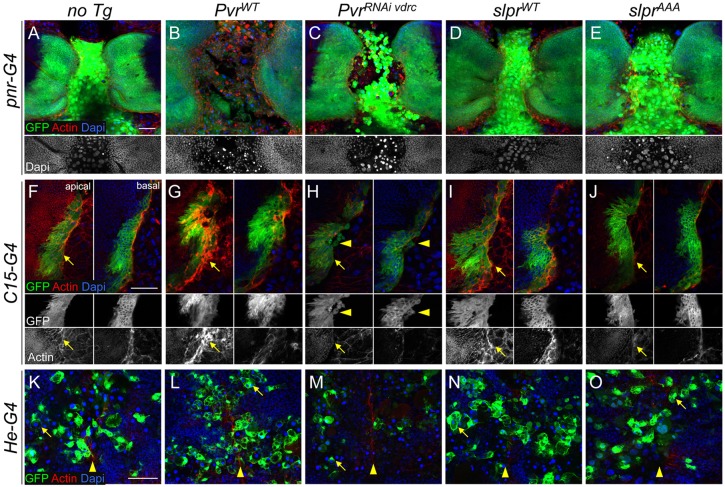
Fig. 10.
Differential effects of Pvr on tissues during thorax closure. (A-O) Confocal images of fixed pupal tissues during thorax closure with the indicated markers. (A-E) pnr-G4-directed GFP expression without (A) or with (B-E) transgene co-expression. Altering Pvr levels has a dramatic effect on centrally positioned larval cells. The grayscale DAPI channel (beneath) highlights pyknotic nuclei (B,C) versus the control (A) or slpr-expressing (D,E) samples. (F-J) Single apical and basal sections of pupal wing discs expressing GFP and transgenes with C15-G4. The midline is toward the right in merged and single-channel images (beneath). F-actin at the leading front (arrows) is highly enriched upon Pvr overexpression (G), and blunted by Pvr knockdown (H) or Slpr inhibition (J). Slpr overexpression has a mild enhancing effect on actin levels (I). Arrowheads identify round stray cells depleted for Pvr and leaving the leading edge (H), whereas cells with increased Pvr are flat and spreading (G). (K-O) Confocal projection of circulating hemocytes labeled by He-G4-directed GFP expression 12 μm below the notum epithelium, which has closed at the midline (arrowheads). Internalized larval cells with pyknotic nuclei are seen engulfed inside hemocytes (arrows). PvrRNAi depletes hemocyte numbers. Scale bars: 50 μm.

