Fig. 2.
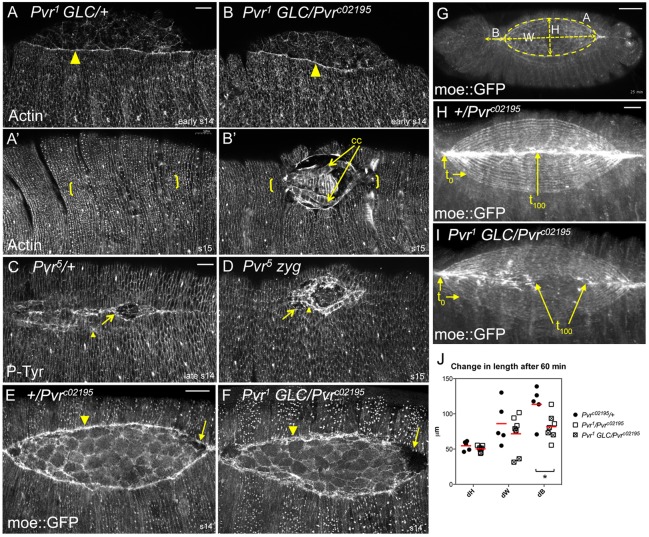
Dorsal closure progression in Pvr mutants. (A-D) F-actin or phosphotyrosine distribution in mid- and late-stage heterozygous (A,C) or homozygous (B,D) Pvr mutant embryos. LE actin (arrowhead) accumulates normally in the mutant (B). At late stages, note the midline (bracketed) defects and unapposed cardiac cells (cc) in mutants (B′,D) compared with controls (A′,C). Cardiac cells (arrowhead), which normally trail the LE (arrow, C), were exposed in unclosed Pvr5 mutants (D). (E-I) moe::GFP localization in live embryos. LE pursestring (arrowhead, E,F) is less uniform and zipping canthi are in different focal planes in Pvr mutants (arrows, E,F). (G) Single image from time-lapse movie of dorsal closure illustrating the values quantified in J (see Materials and methods). (H,I) Cumulative projections of 20 frames from time-lapse movies of Pvr heterozygote (H) or GLC mutant (I). Contours show 5-min intervals. Control embryo has closed by t100, but the mutant has stalled. (J) Scatter plot comparing change in length of the indicated parameters after 60 min; red bars show mean value. t0 was set when AS height (H) equaled 85±4 μm. dB was significantly different between heterozygous control and Pvr mutants. *P<0.05 (unpaired t-test). n=5 control, n=7 mutant embryos. Scale bars: 20 μm, except 50 μm in G.

