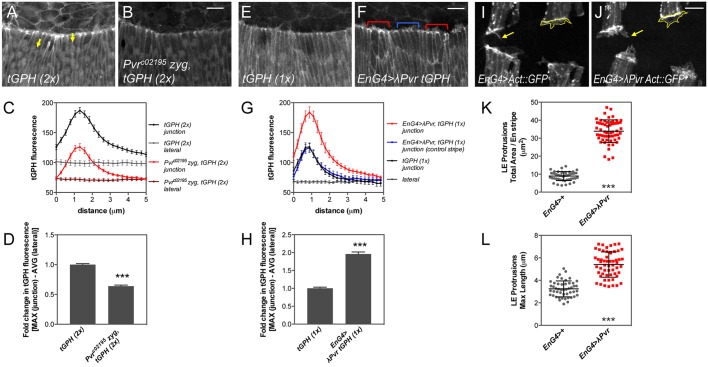
Fig. 6.
Pvr is required for maximal PIP3 accumulation at the LE. (A,B,E,F) Confocal z-projections of the LE of mid-dorsal closure stage live embryos expressing the PIP3 reporter tGPH. Controls with two (A) or one (E) copy of tGPH compared with Pvr mutant (B) or constitutively active Pvr expression in segmental stripes with en-G4 (red bracket) versus control stripe (blue bracket). (C,G) Mean tGPH fluorescence along 5 μm spanning the LE cell junction enriched for PIP3 or lateral membrane control (yellow arrows, A). Error bars represent s.e.m. n=24-28 junctions, 6-7 embryos (C); n=60 junctions, 15 embryos (G). Line color (G) matches bracketed stripes in F. (D,H) Fold change in maximum tGPH fluorescence between control and experimental genotypes, normalized to corresponding averaged lateral membrane values. Error bars show s.e.m. (I,J) en-G4 driving GFP-labeled Actin to reveal LE protrusions (outlines, arrows), without (I) or with (J) λPvr co-expression. (K,L) Quantification of LE protrusion area and length, respectively. Mean±s.d. n=4 stripes, two time points, 6-7 embryos. ***P<0.0001 (unpaired t-test). Scale bars: 10 μm.

