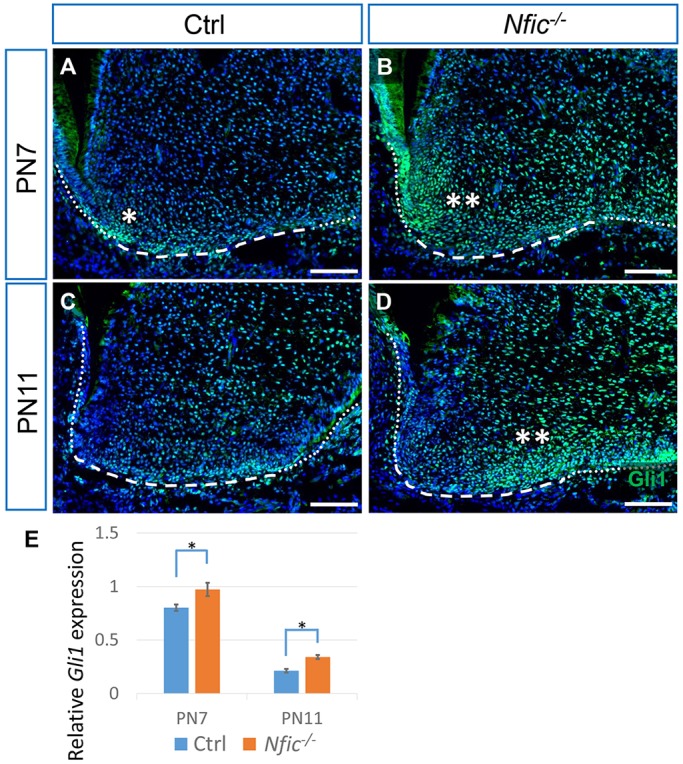
Fig. 4.

Hh activity is elevated in the apical papilla of Nfic–/– mice. (A-D) Immunostaining of Gli1 (green) in the mesial apical papilla of first mandibular molars from PN7 and PN11 control (Ctrl) and Nfic–/– mice. Dotted lines indicate the HERS, dashed lines indicate the border of the apical papilla. Single asterisk indicates positive staining, double asterisk indicate elevated staining signal. (E) Quantitative RT-PCR of Gli1 from the apical tissue of first mandibular molars of control and Nfic–/– mice at PN7 and PN11. n=3 per group. Scale bars: 100 µm. *P<0.05.
