
Fig. 5.
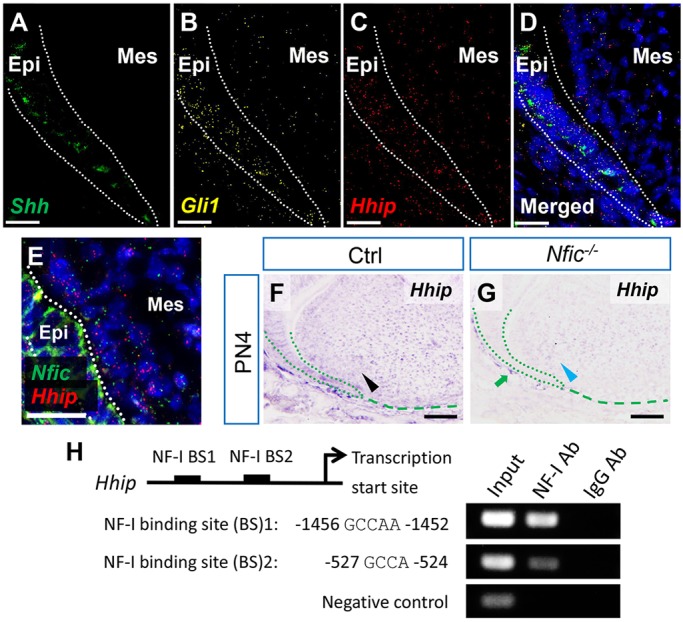
Nfic regulates the Hh signaling pathway via Hhip. (A-D) RNAscope in situ hybridization (ISH) of Shh, Gli1 and Hhip in first mandibular molars from PN4 control mice. Dotted lines indicate the dental epithelium. (E) RNAscope ISH of Nfic and Hhip in first mandibular molars from PN4 control mice. Dotted lines indicate the dental epithelium. (F,G) ISH of Hhip in first mandibular molars from PN4 control (Ctrl) and Nfic–/– mice. Black arrowhead indicates positive signal in the dental papilla. Blue arrowhead indicates reduced signal in the dental papilla. Green arrow indicates positive signal in the dental follicle. Green dotted lines indicate the dental epithelium, green dashed lines indicate the apical border of the dental papilla. (H) Schematic diagram of the upstream region of the mouse Hhip gene shows locations of putative NF-I binding sites tested in ChIP assays (not to scale). Putative binding sequences are shown below. (Right) ChIP assays of chromatin fragments immunoprecipitated with anti-NF-I antibody (Ab) or IgG control antibody. Immunoprecipitates were PCR-amplified, with primers flanking the putative binding sites or negative control region without binding site. Input lane shows PCR amplification of chromatin fragments without immunoprecipitation. n=3 per group. Epi, epithelium; Mes, mesenchyme. Scale bars: 25 µm in A-E; 100 µm in F,G.