Fig. 6.
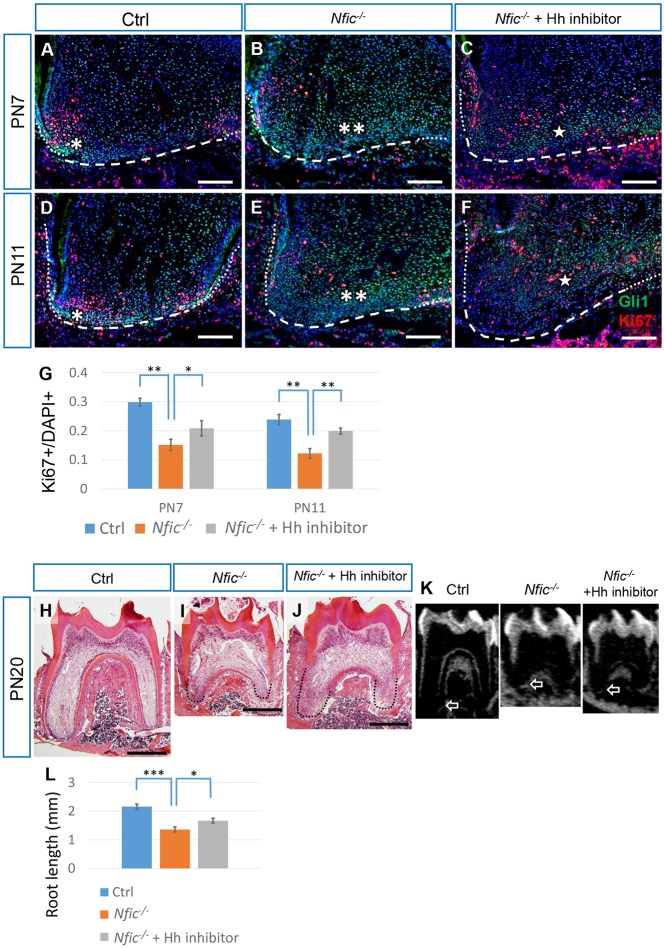
Attenuation of elevated Hh activity partially rescues the cell proliferation and root defects in Nfic–/– mice. (A-F) Immunostaining of Gli1 (green) and Ki67 (red) in the mesial apical papilla of first mandibular molars from PN7 and PN11 control mice (Ctrl), Nfic–/– mice and Nfic–/– mice treated with Hh inhibitor. Dotted lines indicate the HERS, dashed lines indicate the border of the apical papilla. Single asterisk indicates Gli1 signal; double asterisks indicate elevated Gli1 signal; single five-point star indicates attenuated Gli1 signal. (G) Quantification of Ki67+ nuclei/total nuclei from A-F. n=3 per group. (H-K) HE staining and micro-CT slice views of first mandibular molars from PN20 control mice (Ctrl), Nfic–/– mice and Nfic–/– mice treated with Hh inhibitor. Dotted line indicates the root in H-J. White arrows indicate the apical end of the mesial root in K. (L) Quantification of the sum of the mesial and distal root lengths of first mandibular molars at PN20 from micro-CT. n=5 for Ctrl and Nfic–/– mice, n=9 for Nfic–/– mice treated with Hh inhibitor. Scale bars: 100 µm in A-F; 500 µm in H-J. *P<0.05; **P<0.01;***P<0.001.

