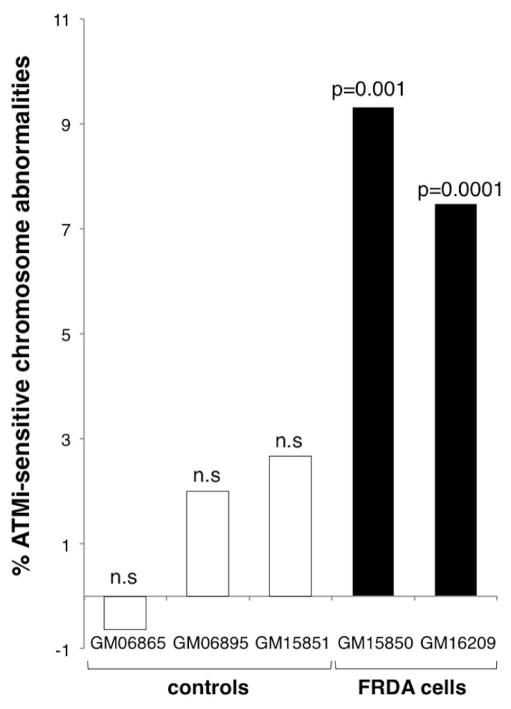
Fig. 5. FRDA cells show elevated levels of chromosomal abnormalities in response to ATM inhibition.
The percentage of ATM-sensitive chromosome abnormalities was obtained by subtracting the abnormalities seen in mock treated cells from the abnormalities seen in ATMi treated cells. P-values were calculated using the Fisher’s test. No significant change was seen in the proportion of duplications to deletions on inhibition of ATM.

