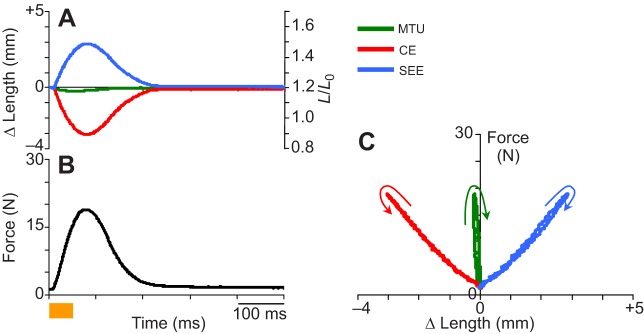
Fig. 2.

Data snapshot from a typical ‘fixed-end’ contraction cycle. (A) Length change of muscle–tendon unit (MTU), muscle fascicle (CE) and series elastic tissue (SEE) versus time, starting with muscle stimulation onset. Left axis is absolute length and right axis is strain with respect to fascicle rest length L0. (B) Force versus time. The orange bar under this axis indicates onset/offset and duration (50 ms) of the applied electrical stimulation. (C) Work loop dynamics observed in a typical ‘fixed-end’ contraction. Note significant internal shortening and lengthening of CE and SEE, respectively when CE is activated and MTU length is held constant.
