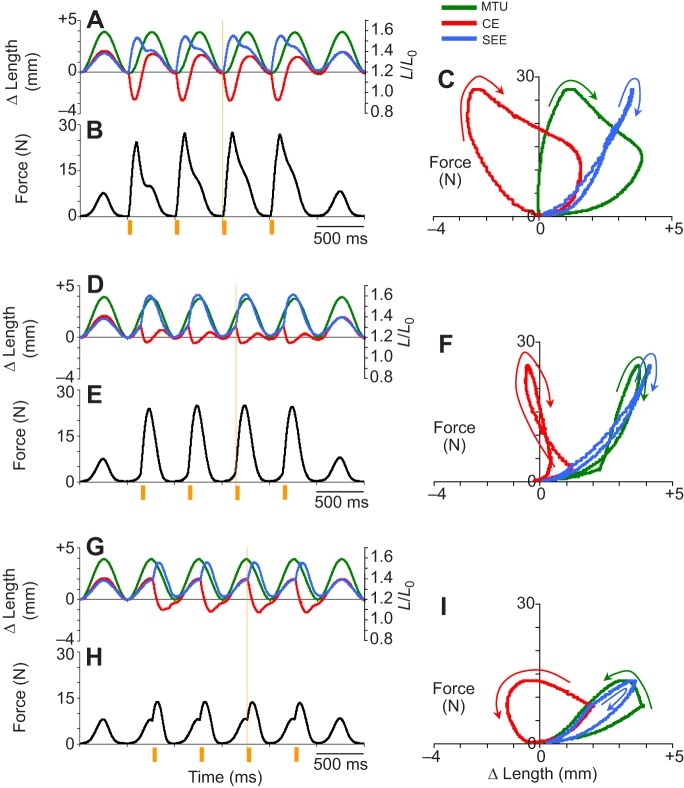
Fig. 3.
Work loop dynamics for the MTU, CE and SEE for different stimulation phases. Cyclic contraction dynamics observed for (A–C) 0%, (D–F) +25% and (G–I) +50% muscle stimulation phase. Each condition was subjected to six cycles of MTU shortening/lengthening. Plots of length change, Δ length (left axis) and CE strain (right axis) versus time (A,D,G), force versus time (B,E,H) and average work loop dynamics (force versus Δ length) (C,F,I) for stretch–shorten cycles where stimulation was applied are shown for each condition. Dynamics for the MTU, CE and the SEE are displayed where appropriate. Orange bars beneath plots of force versus time (B,E,H) indicate timing (i.e. phase) and duration (duty=10% or 50 ms) of muscle stimulation. Note that electrical stimulation is only applied in the middle four cycles, with the first and last stretch–shorten cycles occurring in the absence of stimulation (i.e. passively). Work loops traveling clockwise generate net negative work over a cycle [e.g. CE and MTU with muscle simulation phase=0% (C)]; work loops traveling counter clockwise generate net positive work over a cycle [e.g. CE and MTU with muscle simulation phase=50% (I)].

