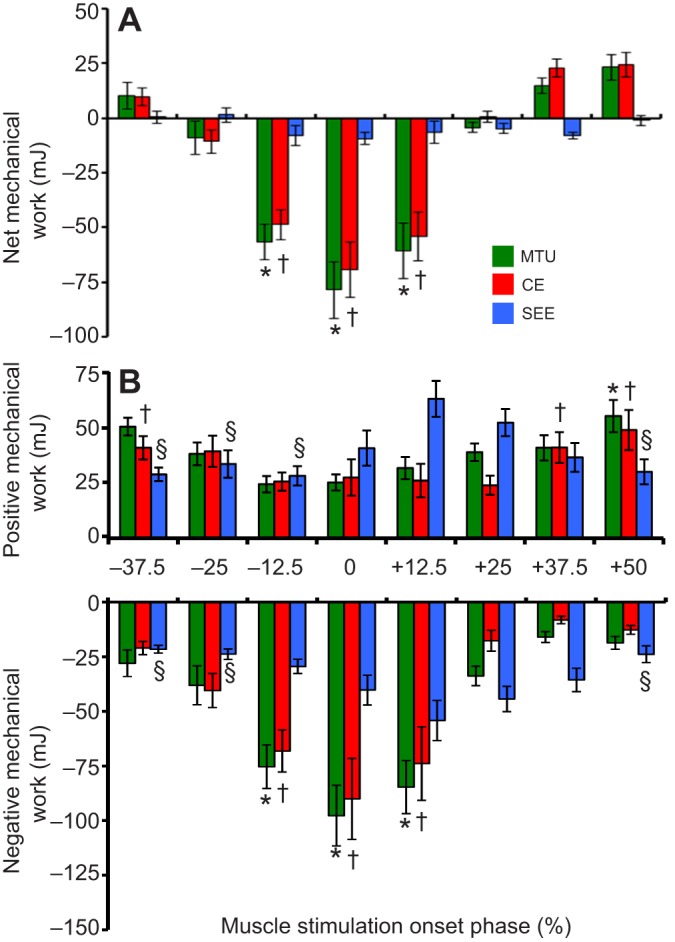
Fig. 7.

MTU component net, positive and negative work versus stimulation phase. (A–C) Mean±s.e.m. net (A), positive (B) and negative (C) mechanical work performed over a full stretch–shorten cycle for the MTU, CE and SEE. Net MTU work output shifts from absorption to generation as muscle stimulation phase increases from −25 to +50%. Mechanical work values significantly different (Tukey's; P<0.05) than those observed in the +25% muscle stimulation phase condition are marked with * for MTU, † for CE and § for SEE.
