Fig. 2.

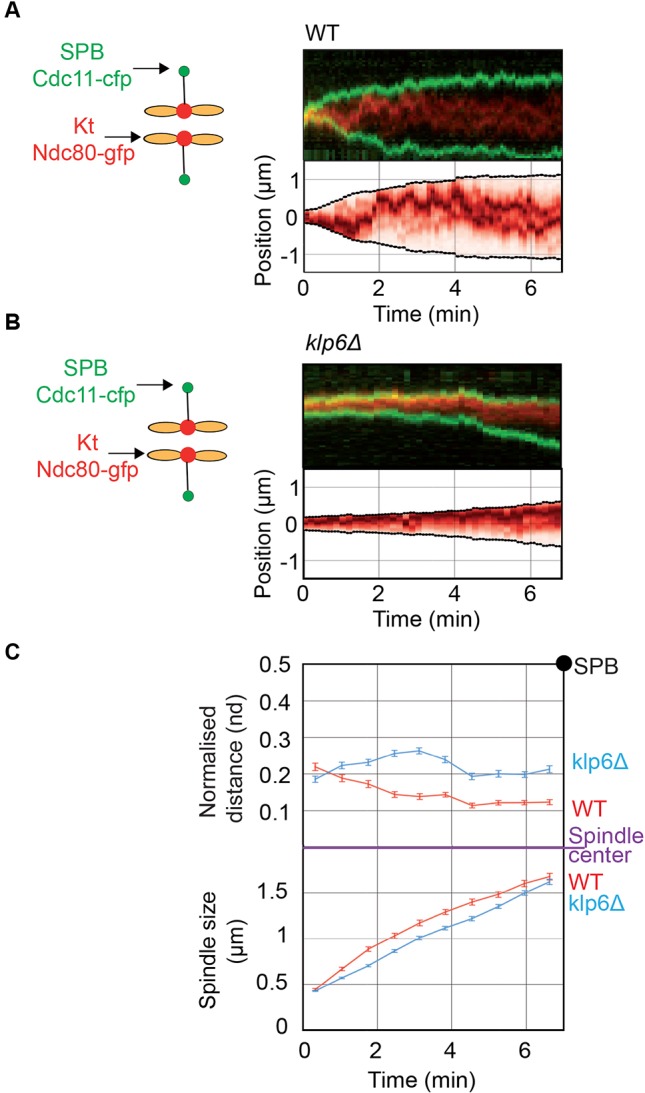
Kinesin-8-dependent chromosome alignment is performed through an active process before metaphase. (A,B) Upper panel. Typical kymographs of wild-type (WT) or klp6Δ cells expressing Ndc80–GFP (shown in red) and Cdc11–CFP (shown in green) from prophase to metaphase. Frames were taken every 5 s. The lower panel shows a computed kymograph where each time-point was normalized to the median intensity of the Ndc80 signal in the whole stack. (C) Upper panel; mean kinetochore distance to the spindle center normalized to spindle size (nd). The position of the maximum peak of intensity in the normalized kymographs (example in lower panel A and B) is used to identify the average position of the three chromosomes (assuming that they are close to each other in prophase). Data obtained from multiple kymographs of cells (n=27 for wild type; n=34 for klp6Δ) were used to plot the average position of kinetochores according to time. The time zero represents phase 1 onset; error bars are s.e.m. Note that the value of kinetochore positioning obtained at 4 min is very similar to that found in Fig. 1E. Lower panel; corresponding mean spindle size.
