Fig. 1.
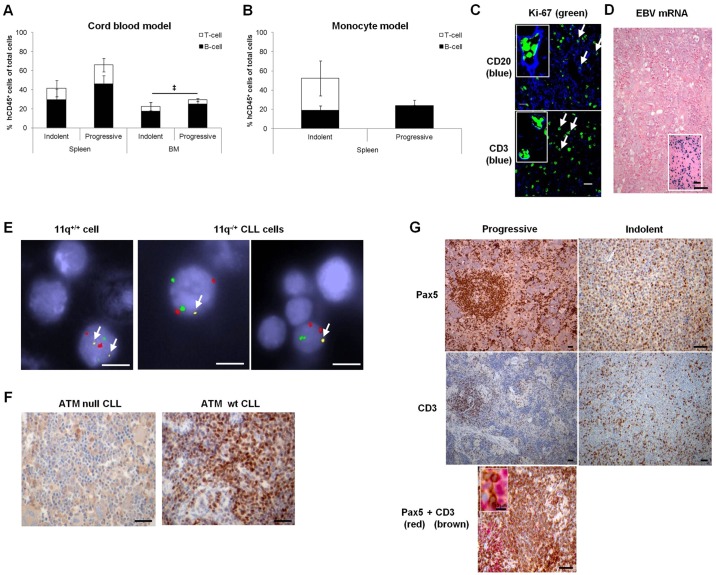
CLL xenografts of a range of biological subtypes recapitulate patient-specific CLL features. (A) The proportion of B cells (CD3−) or T cells (CD3+) that comprise the percentage of engrafted human lymphocytes (hCD45+) of total extracted cells at termination, in murine spleen or bone marrow (BM), upon engraftment of indolent (4 CLL, 8 mice, 7.1±0.9×10⁷ PBMC/animal) or progressive (5 CLL, 13 mice, 2.4±0.6×10⁷ PBMC/animal) CLLs in the cord blood model. (B) The proportion of B or T cells that comprise the percentage of engrafted human lymphocytes (hCD45+) of total extracted cells upon engraftment of indolent (2 CLL, 3 mice, 6.8±3.2×10⁷ PBMC/animal) or progressive (1 CLL, 4 mice, 0.5±0.0×10⁷ PBMC/animal) CLLs in the monocyte model. The majority of the remainder of the total cell population (hCD45−) is of murine origin, possibly with a few human cells expressing undetectable levels of hCD45, including negligible levels of natural killer cells. (C) Representative immunohistological micrographs of CLL engrafted murine spleens depicting expression of Ki67 in proliferating human CD20+ B cells and CD3+ T cells (examples indicated by white arrows). Images were captured by the Zeiss Zen780 confocal microscope (Cambridge, Cambridgeshire, UK) at 40× magnification prior to article production. (D) Engrafted cells were not derived from normal B cells latently infected with EBV (inset shows positive control). (E) Representative example of 11q−/+ cell engraftment identified by FISH. Normal cells contain two copies each of chromosome 10 (red control spots), chromosome 12 (green spots) and 11q (yellow spots, white arrows). The 11q−/+ cells in the right hand micrographs only contain a single 11q allele. Cells were visualised at 100× magnification prior to article production. (F,G) Representative immunohistological micrographs of CLL engrafted murine spleens depicting expression of (F) ATM and (G) markers of B-CLL cells (Pax5) and T cells (CD3). (D,F,G) Images were captured by the Leica DMLB microscope with a Leica DFC320 camera (Milton Keynes, Buckinghamshire, UK) at 10× magnification prior to article production. Engraftment levels were compared using one-way analysis of variance (ANOVA) with Tukey post-test (A) or a two-tailed t-test (B) and statistical significance denoted by ‡P≤0.05 (hCD45 engraftment). Scale bars: 20 µm (C), 50 µm (D,F,G), 5 µm (E).

