Fig. 4.
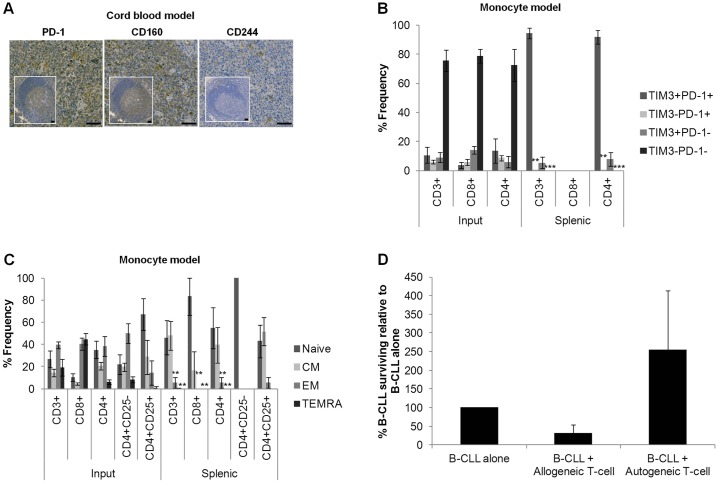
Engrafted T cells display a dysfunctional phenotype typical of CLL. (A) Representative immunohistological micrographs depicting expression of the exhausted markers hPD-1, hCD160 and hCD244 in spleens engrafted using the cord blood model in comparison with healthy human tonsils (inset). Images were captured by the slide visual Olympus Dotslide microscope (Southend-on-Sea, Essex, UK) at 20× magnification prior to article production. Scale bars: 50 µm. The virtual slide images (VS120) were analysed by OlyVIA (free software, www.olympus.software.informer.com). (B) FACS analysis demonstrating the T-cell expression of markers of exhaustion (TIM3+ PD-1+), anergy (TIM3− PD-1+), senescence (TIM3+ PD-1−) and normal function (TIM3− PD-1−) (Crespo et al., 2013) in the monocyte model (2 CLL, 5 mice) and patient PBMCs (3 CLL). (C) FACS quantification of naive (CCR7+ CD45RA+), CM (CCR7+ CD45RA−), EM (CCR7− CD45RA−) and TEMRA (CCR7− CD45RA+) human T cells from either injected patient PBMCs (3 CLL) or xenograft-derived splenic cells (3 CLL, 6 mice). (D) Quantification by FACS analysis of CD19+ B-CLL cells following co-culture of splenic T cells with B-CLL cells at a ratio of 3:1 reveals a tolerance to the autologous input B cells (n=3). Data was normalised to the number of surviving B cells after culture of CD19+ B-CLL cells in the absence of extraneous T cells (B-CLL alone). Data were compared using one-way ANOVA with Tukey post-test and statistical significance versus input (B,C) or B-CLL alone (D) denoted by **P≤0.01, ***P≤0.001.

