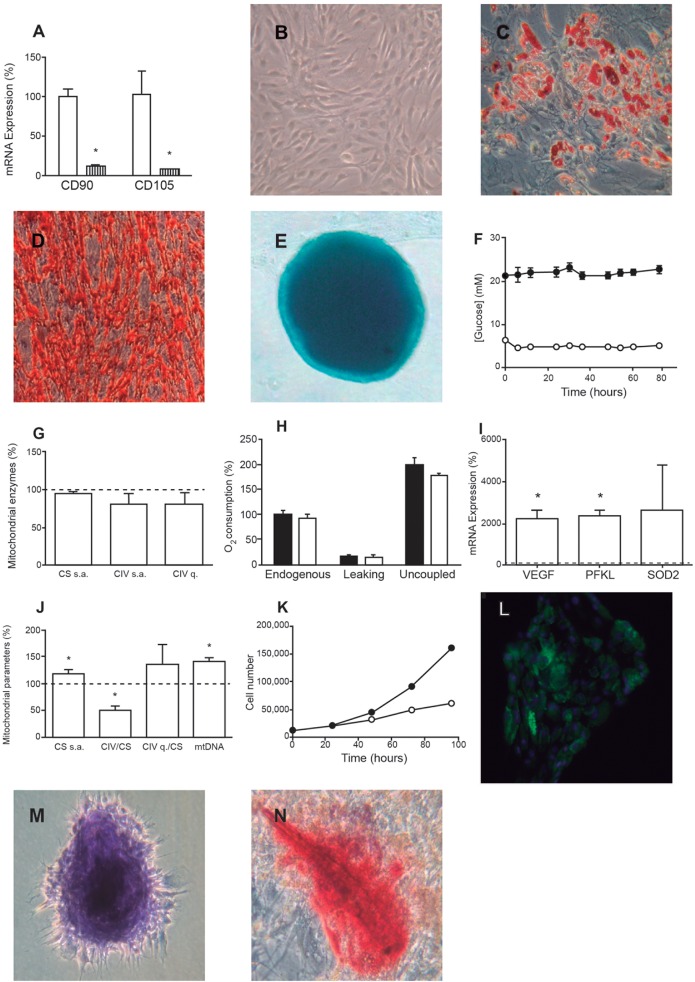
Fig. 1.
hASC characterization. (A) Expression of hASC marker mRNAs. White bars represent hASCs. Striped bars represent neuroblastoma SK-N-BE(2)-C cells, as a negative control. *P≤0.0044. (B-E) Representative microscopy images of hASCs (B), hASCs differentiated to adipocytes (Oil Red) (C), hASCs differentiated to osteocytes (D) and hASCs differentiated to chondrocytes (micromass culture) (E). (F) Glucose concentration of hASC culture medium. Black and white circles indicate 25 and 5 mM glucose, respectively. (G) Mitochondrial enzymes specific activities (s.a.) and levels (q). White bars indicate the value of enzymatic parameters of cells grown at 5 mM glucose. Dotted line represents the value of these variables for cells grown at 25 mM glucose. (H) Oxygen consumption of cells grown at 25 mM (black bars) and 5 mM (white bars) glucose. (I) Expression of hypoxia (3% O2) mRNA markers. Dotted line at 100% represents the value of these variables at 20% oxygen. *P≤0.0162. (J) Effect of hypoxia on mitochondrial variables. Dotted line represents the value of these variables at 20% oxygen. *P≤0.0178. (K) hASC doubling time. Black or white circles indicate normoxia or hypoxia, respectively. (L-N) Representative optical microscopy images of hASCs differentiated to adipocytes (Nile Red) (L), chondrocytes (normal culture) (M) and osteocytes (N) in hypoxia.

