Fig. 3.
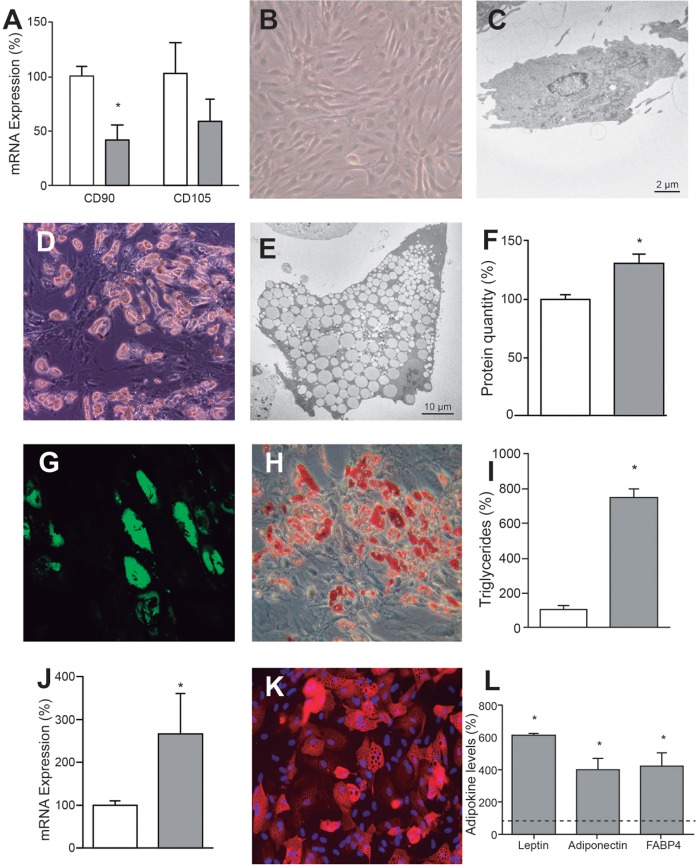
Adipogenic differentiation. (A) Expression of hASC marker mRNAs. White and gray bars represent hASCs and adipocytes, respectively. *P=0.0035. (B,C) Representative optical (B) and electron microscopy (C) images of hASCs. (D,E) Representative optical (D) and electron microscopy (D) images of adipocytes. (F) Cell protein amount. White and gray bars represent the protein quantity per million cells of hASCs and adipocytes, respectively. *P=0.0314. (G,H) Representative microscopy images of adipocytes stained with Nile Red (G) or Oil Red O (H). (I) Cell triglyceride levels. White and gray bars represent the quantity of triglycerides in hASCs and adipocytes, respectively. *P<0.0001. (J) Expression of PPARγ mRNA. White and gray bars represent hASCs and adipocytes, respectively. *P=0.0442. (K) Representative immunocytochemical image of adipocytes FABP4. (L) Adipokine levels secreted by adipocytes. Dotted line represents the levels found in the hASC culture medium. *P≤0.0117.

