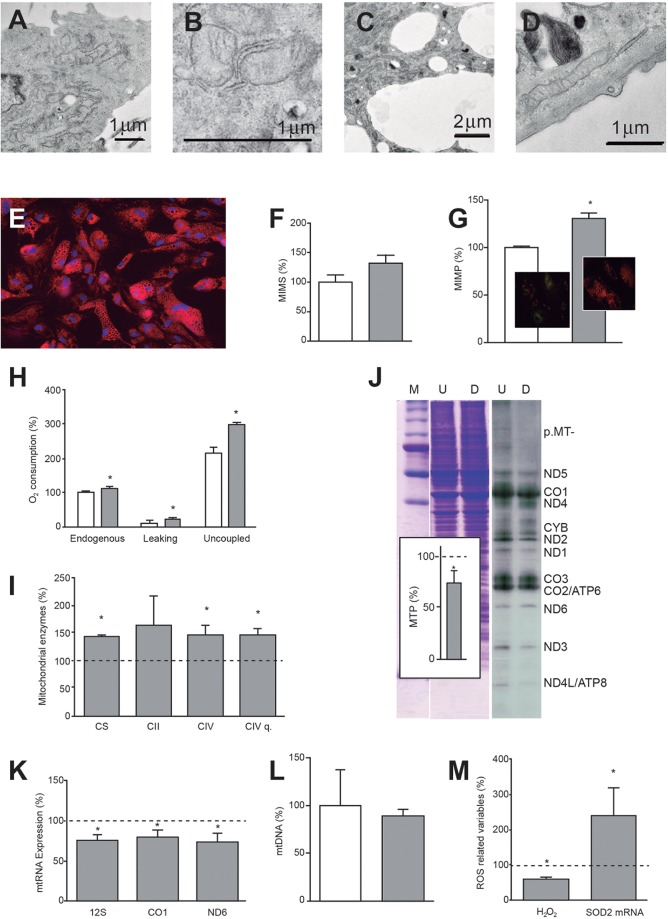
Fig. 4.
Mitochondrial changes during adipocyte differentiation. (A,B) Representative electron microscopy images of part of a hASC (A) and mitochondria (B). (C,D) Representative electron microscopy images of an adipocyte fragment (C) and mitochondrion (D). (E) Representative microscopy image of the mitochondrial disposition in adipocytes. (F) MIMS. White and gray bars represent hASC and adipocyte MIMS values, respectively. (G) MIMP. White and gray bars represent hASC and adipocyte MIMP values, respectively. *P=0.0034. Inserts: representative images of hASCs (left) and adipocytes (right) stained with a dye used to measure MIMP. Green changes to orange when MIMP increases. (H) Oxygen consumption. White and gray bars represent values of consumed oxygen in hASCs and adipocytes, respectively. *P≤0.0361. (I) Mitochondrial enzyme specific activities and quantity (q) in adipocytes. Dotted line represents enzyme activities and amount found in hASCs. *P≤0.0388. (J) Mitochondrial protein synthesis. Representative gel showing the electrophoretic patterns of mitochondrial translation products (ND1-6,CYB, CO1-3 and ATP6,8) (right) and loading controls (left). M, molecular weight marker; U, undifferentiated cells (hASCs); D, differentiated cells (adipocytes). Insert: quantification of mitochondrial translation products (MTPs) in adipocytes. Dotted line represents the level of MTPs in hASCs. *P=0.0210. (K) Mitochondrial transcripts in adipocytes. Mitochondrial RNA levels (12S, CO1 and ND6) represent the three transcription units of the mtDNA. Dotted line represents levels in hASCs. *P≤0.0104. (L) mtDNA levels. White and gray bars represent the mtDNA amount in hASCs and adipocytes, respectively. (M) H2O2 quantity and SOD2 mRNA levels in adipocytes. Dotted line represents levels of these parameters in hASCs. *P≤0.0463.

