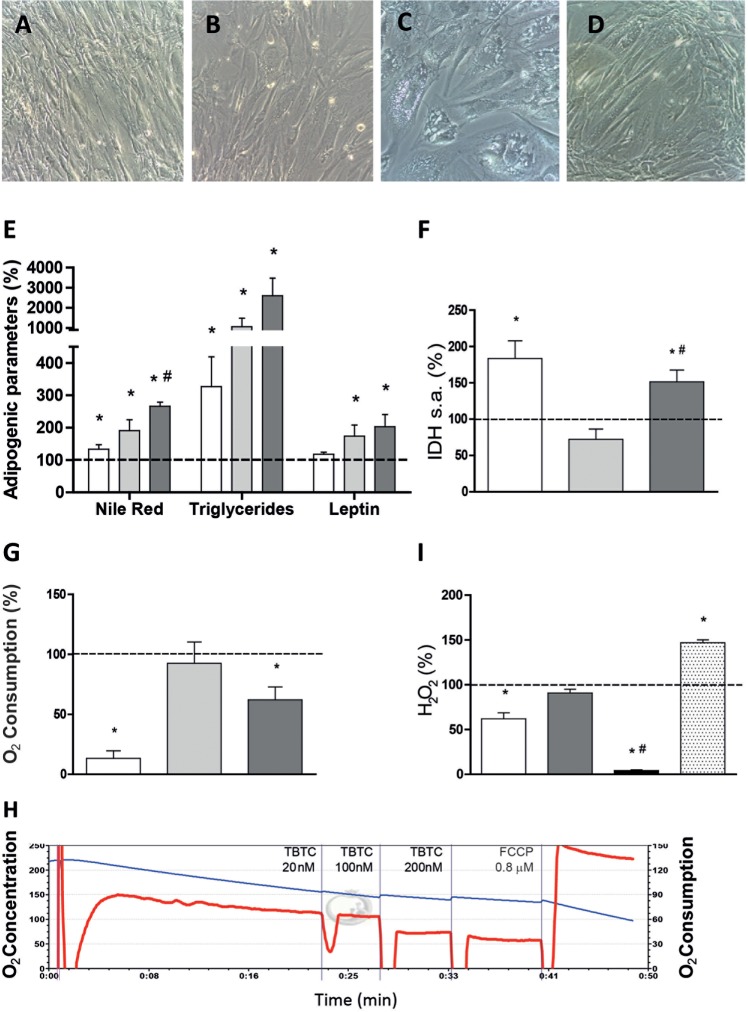
Fig. 7.
Response of adipogenic and mitochondrial parameters to TBTC. White, light and dark gray bars indicate 16 nM OLI-, 20 nM TBTC- and 100 nM TBTC-treated hASCs, respectively. Dotted lines represent levels in untreated hASCs. (A-D) Representative microscopy images of untreated hASCs (A), hASCs treated with 16 nM OLI (B), hASCs treated with 20 nM TBTC (C) and hASCs treated with 100 nM TBTC (D). (E) Adipogenic variables. *P≤0.0256, #P=0.0221 (vs 20 nM TBTC). (F) IDH levels. *P≤0.0173, #P=0.0030 (vs 20 nM TBTC). (G) Determination of oxygen consumption just after drug addition. *P≤0.0403. (H) Oxygen consumption plot. Blue and red lines represent oxygen concentration and consumption, respectively. (I) Determination of H2O2 levels after drug addition. White, gray, black and dotted bars represent 16 nM OLI-, 100 nM TBTC-, 100 nM TBTC+5 mM NAC- and 10 μM Menadione-treated hASCs, respectively. *P≤0.0021, #P<0.0001 (vs 100 nM TBTC).

