Fig. 5.
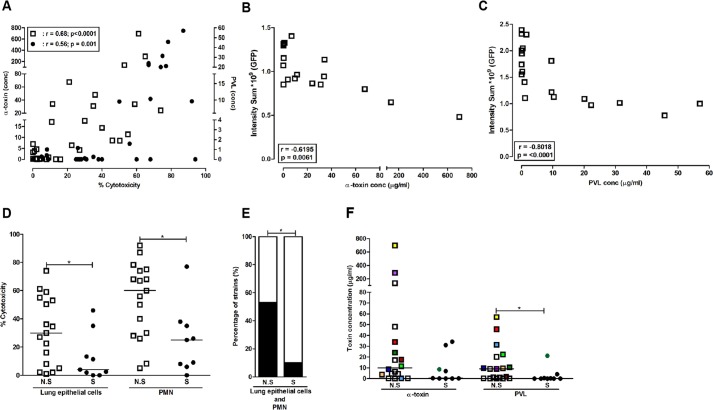
Toxin levels and cytotoxic activity in supernatants from community acquired (CA) pneumonia isolates. A collection of CA pneumonia isolates (n=31) was analysed for toxin levels and cytotoxic activity in bacterial culture supernatants. (A) Correlation of cytotoxic activity in bacterial culture supernatants towards lung epithelial cells versus α-toxin concentrations (left y-axis; open symbols) and neutrophils versus PVL levels (right y-axis; filled symbols). (B,C) Live imaging analysis of lung tissue models exposed for 16 h to culture supernatants from CA pneumonia strains (n=18, selected to obtain a representative collection of supernatants with varying α-toxin and PVL levels). The graphs show the correlation between epithelial injury (intensity sum) and levels of α-toxin (B) and PVL (C) in the culture supernatants. (D) Comparison between percentage cytotoxicity elicited towards lung epithelial cells and neutrophils (PMN) by strains isolated from non-survivors (NS) and survivors (S). (E) Strains were divided as eliciting high (>30%, black bars) or low (<30%, white bars) cytotoxicity. (F) α-toxin and PVL levels in bacterial supernatants of strains isolated from survivors (S) versus non-survivors (N.S). Pearson's correlation test was used in A-C, and P and r values are indicated. Statistical differences between N.S and S were determined using the Mann–Whitney test in D and F, and Fisher's exact test in E; *P<0.05.

