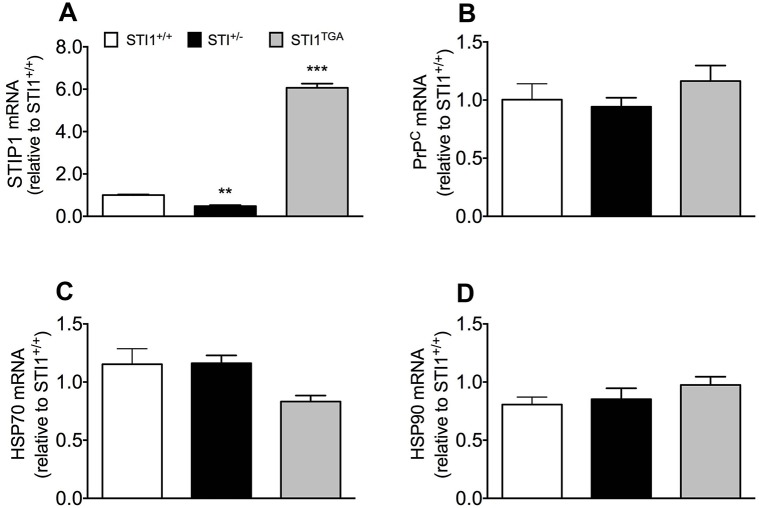
Fig. 1.
Analyses of mRNA for STIP1 partners in STI1+/+, STI1−/+ and STI1TGA mouse brains. (A) STIP1 mRNA expression (n=9 STI1+/+, n=5 STI1TGA and n=4 STI1−/+). (B) PrPC mRNA expression (n=8 STI1+/+, n=4 STI1TGA and n=7 STI1−/+). (C) Hsp70 mRNA expression (n=8 STI1+/+, n=4 STI1TGA and n=7 STI1−/+). (D) Hsp90 mRNA expression (n=3 STI1+/+, n=4 STI1TGA and n=4 STI1−/+). Results are presented as means±s.e.m.; data were analyzed and compared by one-way ANOVA and Bonferroni multiple comparisons post-hoc test; **P<0.001 and ***P<0.0001 compared with control.

