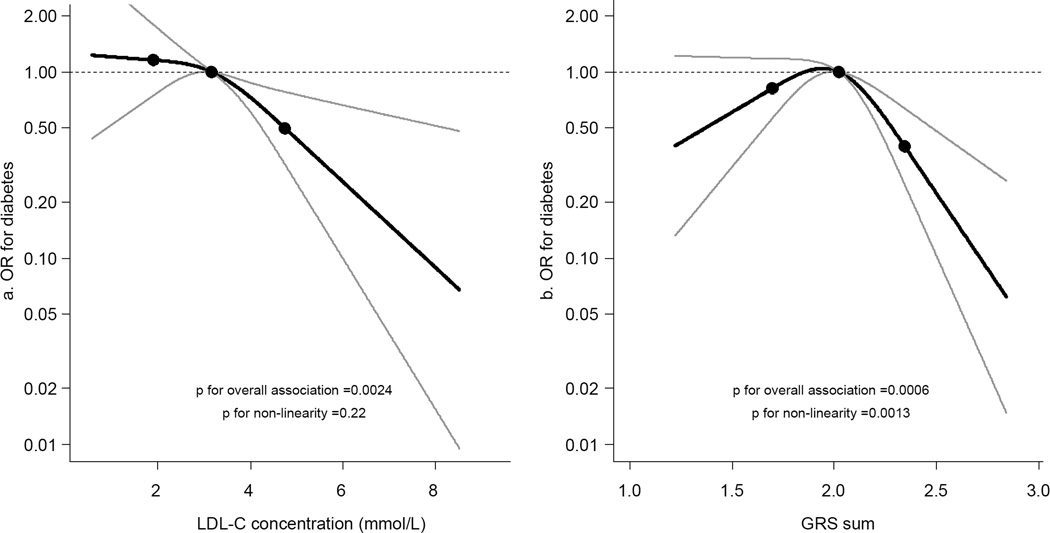
Fig. 1.
Splines illustrating the OR of developing diabetes for LDL-C concentration (a) and the GRS underlying LDL-C concentration (b). Knots are placed at the 5th, 50th and 95th percentiles. Both models were adjusted for time between examinations, examination, HDL-C and triacylglycerol concentrations, sex, age, BMI, systolic and diastolic blood pressures and fasting blood glucose levels. p for overall association = 0.0024 (a) and 0.0006 (b); p for nonlinearity = 0.22 (a) and 0.0013 (b). The y-axes are on a log scale

