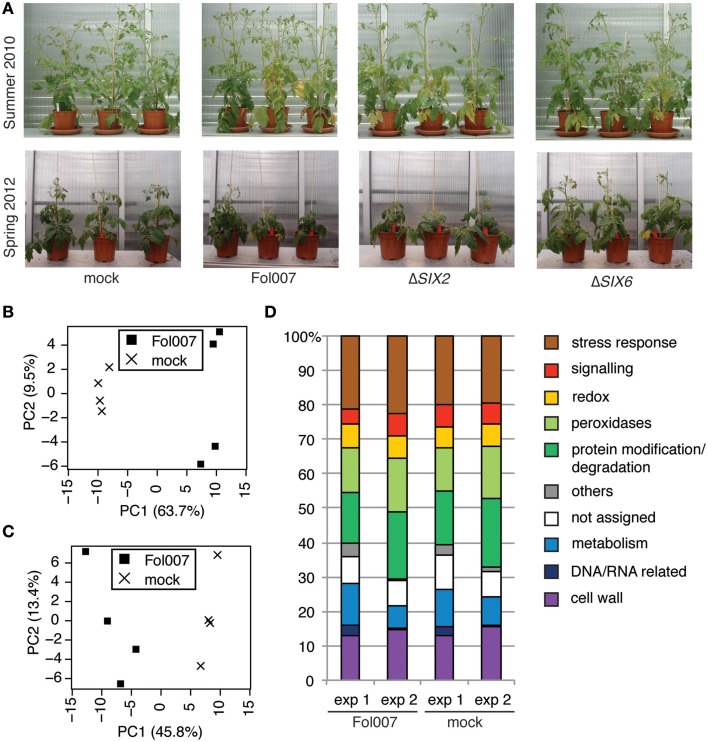
Figure 5.
The proteome of xylem sap harvest performed in different seasons is comparable on data- and biological-level. (A) Photographs taken from two different bioassays performed in either summer 2010 or spring 2012, when clear disease symptoms developed (2–3 weeks after inoculation). Approximately the same magnification was used. Four-week-old plants were mock-treated or inoculated with Fol007, the SIX6 knockout (ΔSIX6) or the SIX2 knockout (ΔSIX2). Plants from summer 2010 were longer and disease symptoms included mainly wilting and yellowing of the leaves. In spring 2012 diseased plants were recognized by epinasty and reduced plant size. (B,C) PCA plot based on the normalized data. PC1 is plotted on the x-axis, PC2 is plotted on the y-axis. The PCA analysis was performed with the proteome data obtained for Fol- or mock-treated plants from data set 1 (B) or from data set 2 (C). (D) Bar chart showing the percentage of xylem sap proteins per GO category for the Fol and mock treatments of data set 1 and data set 2.

