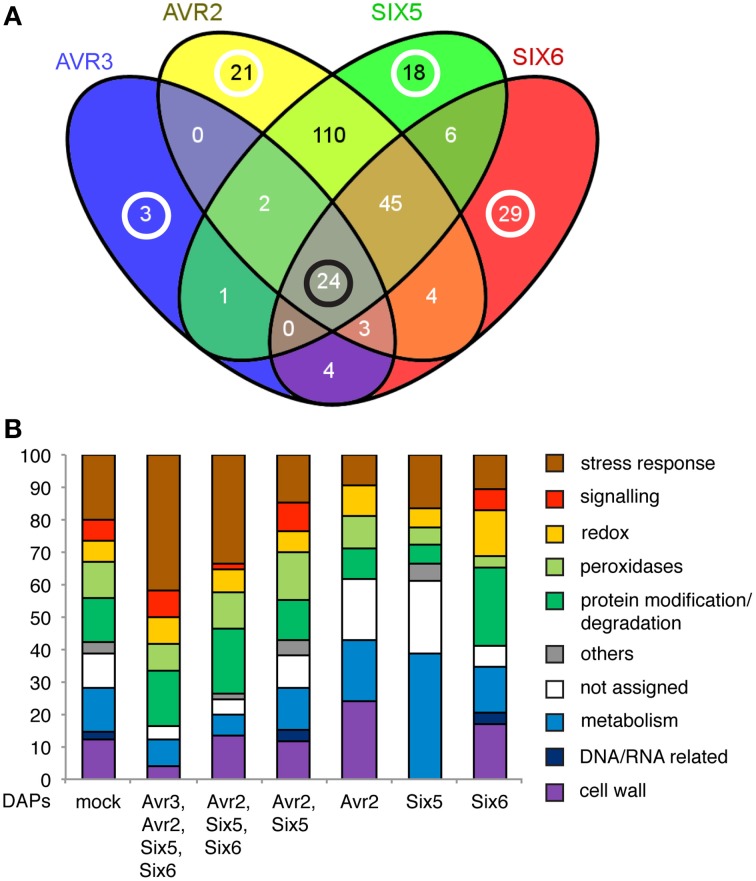
Figure 6.
Effector knockouts have common and specific DAPs. (A) Venn-diagram showing the overlap of DAPs in the contrasts between the AVR3, AVR2, SIX5, SIX6 knockouts with Fol007. Black circle: number of DAPs shared by all effector knockouts, white circles: number of effector knockout specific DAPs. (B) Bar chart depicting the percentages per GO category for all DAPs in the contrast between Fol007 and mock (mock) and for all groups of common [overlap in (A): Avr2, Avr3, Six5, Six6, or Avr2, Six5, Six6, or Avr2, Six5] or specific DAPs (Avr2 or Six5 or Six6) in the contrasts between effector knockouts and Fol007. Groups of DAPs in the Venn-diagram containing less than 10 proteins are not shown.

