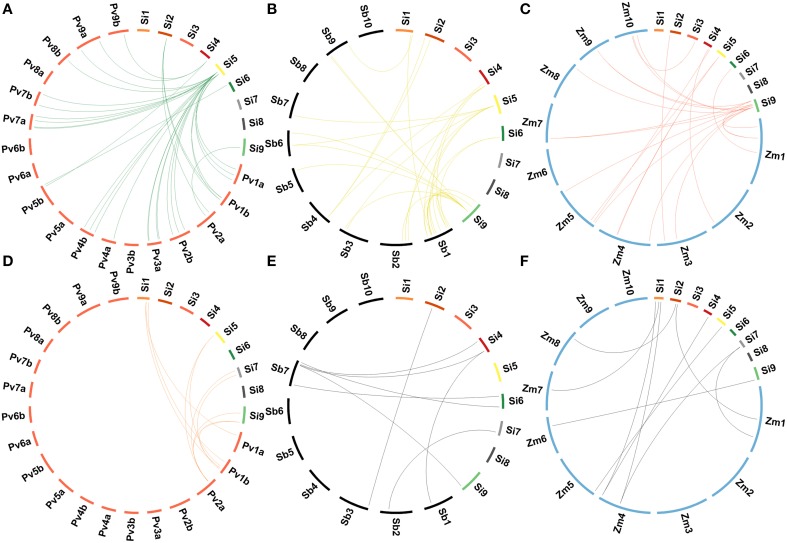
Figure 6.
Comparative genome map showing homologous relationships between CesA/Csl and Gsl superfamilies of Setaria italica and (A) Panicum virgatum, (B) Sorghum bicolor, (C) Zea mays, and between monolignol biosynthesis genes of Setaria italica and (D) Panicum virgatum, (E) Sorghum bicolor, (F) Zea mays.

