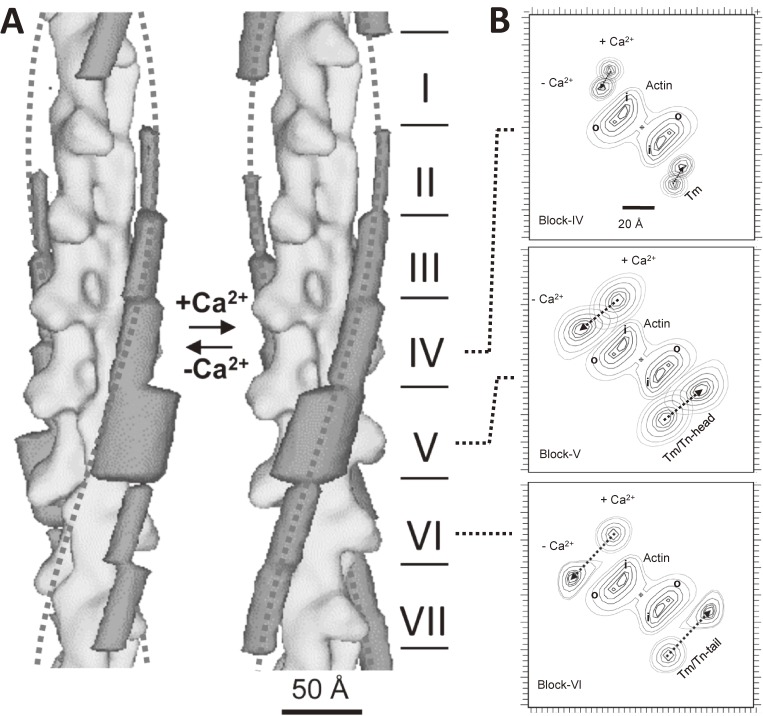
Figure 8.
The differential shift of tropomyosin at low Ca2+ as revealed by single particle analysis of electron cryo-micrographs.84) A. Three-dimensional models of actin-tropomyosin-troponin at low Ca2+ (left panel) and at high Ca2+ (right panel). The whole structures were divided into seven blocks so that each of them contains one actin monomer, and the densities due to tropomyosin-troponin were averaged and shown in dark gray. The block I and VII correspond to the NH-terminal and COOH-terminal regions of tropomyosin, respectively. The dotted lines show smooth helices to indicate the typical position of tropomyosin at high Ca2+. The extent of Ca2+-induced shifts differed between blocks. The M-line locates upwards. B. The top views of the panel A from the M-line side. By the depletion of Ca2+, tropomyosin-troponin moved anticlockwise. The extent of movement differed: about ∼35 Å in the block V and VI, but was small in the block II, III, and IV. After the shift of tropomyosin-troponin, the outer domain of actin and the myosin-binding sites were covered: The evidence for the steric blocking model was provided.

