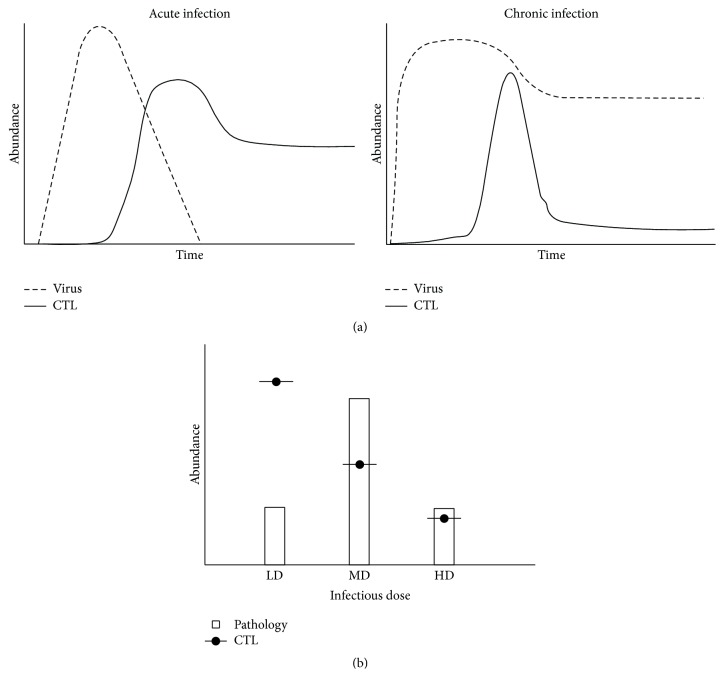
Figure 1.
(a) Schematic view of acute and chronic LCMV infections including virus and cytotoxic T lymphocyte (CTL) dynamics. (b) Representation of the CTL-induced immunopathology dependence on the initial viral infectious dose at day 13 after infection (adapted from Cornberg et al. [62]). LD: low-dose infection; MD: medium-dose infection; HD: high-dose infection.

