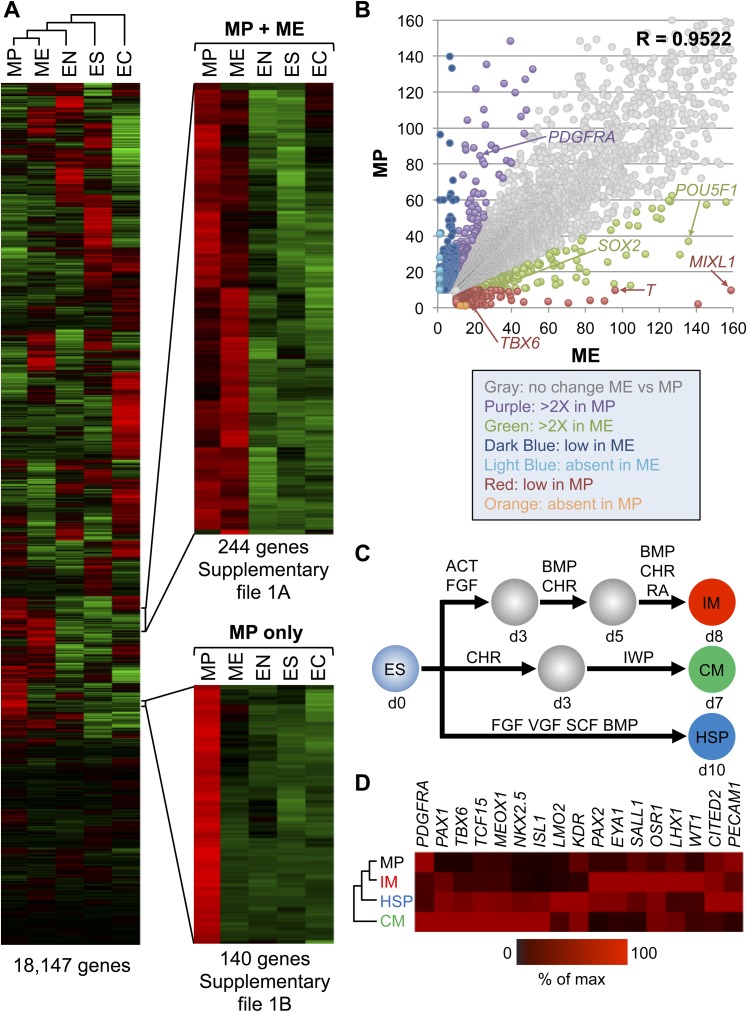
Figure 5. Gene expression analysis reveals that MP cells have an intermediate mesodermal (IM) identity.
RNA sequencing (RNA-seq) was used to analyze gene expression of MP cells. As a comparison, gene expression profiles were analyzed for hES (ES) cells and their differentiated progeny, ME, EN and EC. (A) MP cells resemble mesodermally differentiated cells. Hierarchical clustering analysis was performed for all genes with detectable expression (reads per kilobase per million mapped reads [RPKM] values greater than 10) in one of the five cell populations. Supplementary file 1 provides the complete list of genes shared between MP and ME (A) and genes unique to MP (B). The complete RNA-seq data set for MP cells is provided in Supplementary file 2. (B) Correlation of gene expression profiles. Genes with expression values (RPKM) expression between 10 and 1500 were plotted for MP cells and ME. The correlation coefficient (R) for all expressed genes is 0.9522. (C) Schematic depicting differentiation protocols from hES cells to IM and lateral plate mesoderm (LM) derivatives cardiomyocytes (CMs) and hematopoietic stem and progenitor (HSP) cells. (D) QPCR analysis of IM, CM, HSP, and MP cells revealed that MP cells have a similar expression profile as IM cells. ACT = Activin A, BMP = BMP4, CHR = CHIR98014, d = day, FGF = FGF2, IWP = IWP-2, RA = retinoic acid, VGF = VEGF.

