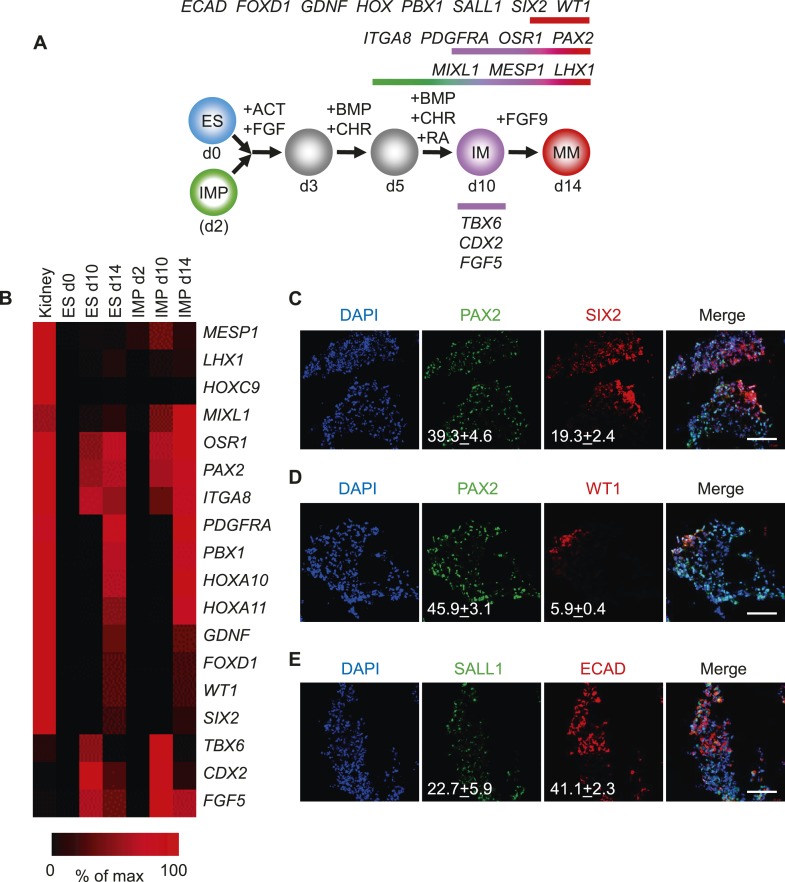
Figure 7. Differentiation of IMP cells into metanephric mesenchyme (MM).
(A) Schematic of the differentiation protocol. Cells were differentiated in a step-wise manner using the indicated GFs and SMs from undifferentiated ES cells or from IMP cells to IM and subsequently to MM. Stage-specific marker genes expressed during this differentiation process are indicated at the top. ACT = ActivinA, BMP = BMP4, CHR = CHIR98014, d = day, FGF = FGF2, RA = retinoic acid. (B) Upon differentiation towards MM, cells expressed genes associated with kidney lineage. QPCR was performed on ES and IMP cells for the indicated genes at various time points. Fetal kidney RNA (11 gestation weeks) was used as a control. The data is displayed as a heat map with black corresponding to minimal expression and red corresponding to maximal levels. (C–E) IF analysis of MP cell-derived MM. IMP cells were differentiated as depicted in panel A, fixed and stained for the indicated proteins and DNA (DAPI). Numbers refer to percentages of cells expressing the protein of interest. Standard deviation represents the variation between the fields of view used for counting (n = 20). Scale bar = 100 µm.

