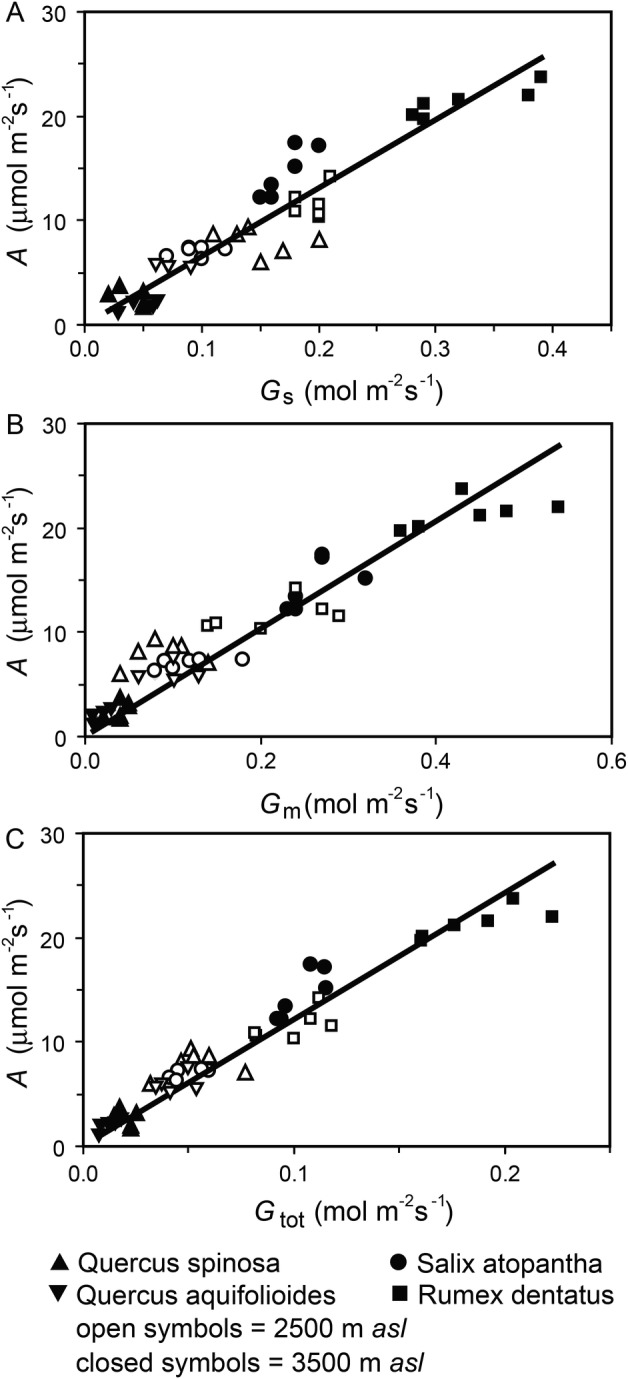
Figure 1.

Relationship between photosynthesis (A) and stomatal (Gs) (regression R2 = 0.8836, F1,45 = 341.775, P = 1.197 × 10⁻²²), mesophyll (Gm) (regression R2 = 0.916, F1,45 = 502.780, P = 2.107 × 10⁻²⁶) and total (Gtot) (regression R2 = 0.943, F1,45 = 745.674, P = 1.195 × 10⁻²⁹) conductance to CO2 at high elevations of 2500 m (open symbols) and 3500 m (filled symbols) a.s.l. of Q. spinosa (upward triangles), S. atopantha (circles) and R. dentatus (squares) from this study and Q. aquifolioides (inverted triangles) from the study of Feng et al. (2013).
