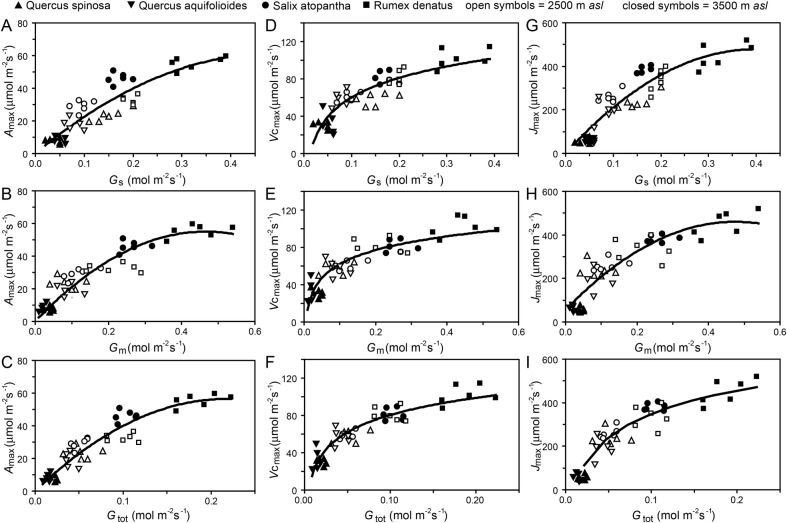
Figure 3.
Relationship between photosynthetic physiological capacity to assimilate CO2 (Amax, Vcmax and Jmax) and conductance to CO2 (Gs, Gm and Gtot) at high elevations of 2500 m (open symbols) and 3500 m (filled symbols) a.s.l. of Q. spinosa (upward triangles), S. atopantha (circles) and R. dentatus (squares) from this study and Q. aquifolioides (inverted triangles) from the study of Feng et al. (2013). (A) Amax versus Gs (regression R2 = 0.791, F1,45 = 147.009, P = 1.272 × 10⁻¹⁵); (B) Amax versus Gm (regression R2 = 0.847, F1,45 = 227.498, P = 3.250 × 10⁻¹⁹); (C) Amax versus Gtot (regression R2 = 0.872, F1,45 = 223.520, P = 7.399 × 10⁻¹⁹); (D) Vcmax versus Gs (regression R2 = 0.788, F1,45 = 156.650, P = 4.277 × 10⁻¹⁶); (E) Vcmax versus Gm (regression R2 = 0.794, F1,45 = 141.911, P = 1.642 × 10⁻¹⁵); (F) Vcmax versus Gtot (regression R2 = 0.859, F1,45 = 181.645, P = 3.186 × 10⁻¹⁷); (G) Jmax versus Gs (regression R2 = 0.834, F1,45 = 149.711, P = 9.323 × 10⁻¹⁶); (H) Jmax versus Gm (regression R2 = 0.818, F1,45 = 136.184, P = 3.323 × 10⁻¹⁵); (I) Jmax versus Gtot (regression R2 = 0.883, F1,45 = 161.692, P = 2.470 × 10⁻¹⁶).

