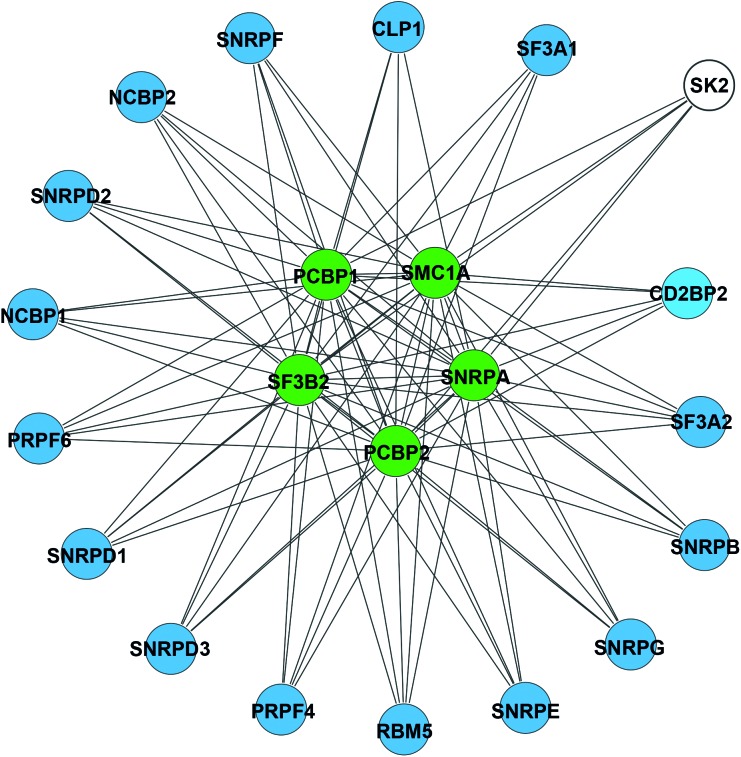
Figure 5.
Identification of SK2 interaction partners during CHIKV infection. Network interaction map showing SK2 interactions gene expression network clusters. Network plots were generated using the Cytoscape 3 network analysis tool. Color codes represent, SK2 (white), proteins that directly interact with SK2 by AP-MS (green), secondary interactions of proteins associated with mRNA processing and gene expression (blue).

