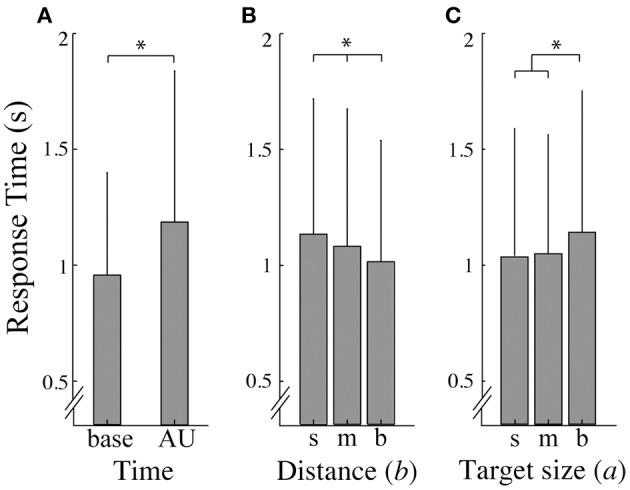
Figure 3.

Response times. (A) Average response time (and standard deviation) as a function of time; base refers to the baseline responses and AU refers to responses in the area of uncertainty. (B, C) represent the average response time (and standard deviation) over a small (s), medium (m), and big (b) distance (B) and target size (C). Asterisks indicate significant effects (α = 0.05).
