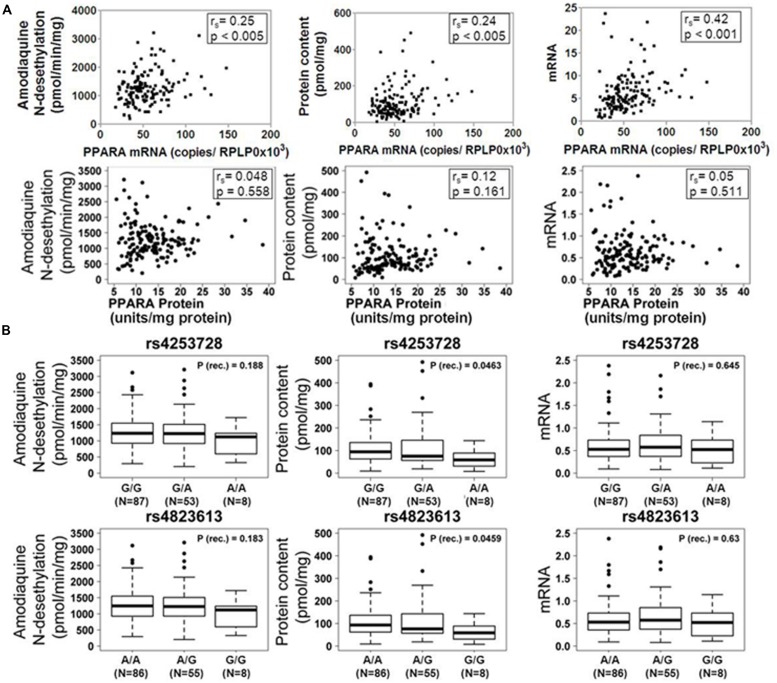
FIGURE 2.
Influence of PPARα expression and genotype on the CYP2C8 phenotype. (A) Scatter plots of CYP2C8 phenotypes (amodiaquine N-desethylation, CYP2C8 protein and mRNA expression) vs. PPARα mRNA (top) and protein (bottom) expression. Spearman’s rank correlation coefficient rs and corresponding p-values are given. (B) Box-and-whisker plots of CYP2C8 phenotypes (Amodiaquine N-desethylation, CYP2C8 protein and mRNA expression) for two previously described intronic PPARA variants. Genotypes are indicated as G/G, G/A, and A/A (for rs4253728) and A/A, A/G, and G/G (for rs4823613). P (rec.), unadjusted p-value of Wilcoxon–Mann–Whitney test for recessive genetic model; N, number of individuals per group; numbers for the three genotype groups do not add up to 150 due to missing values. Outliers were included in all calculations.

