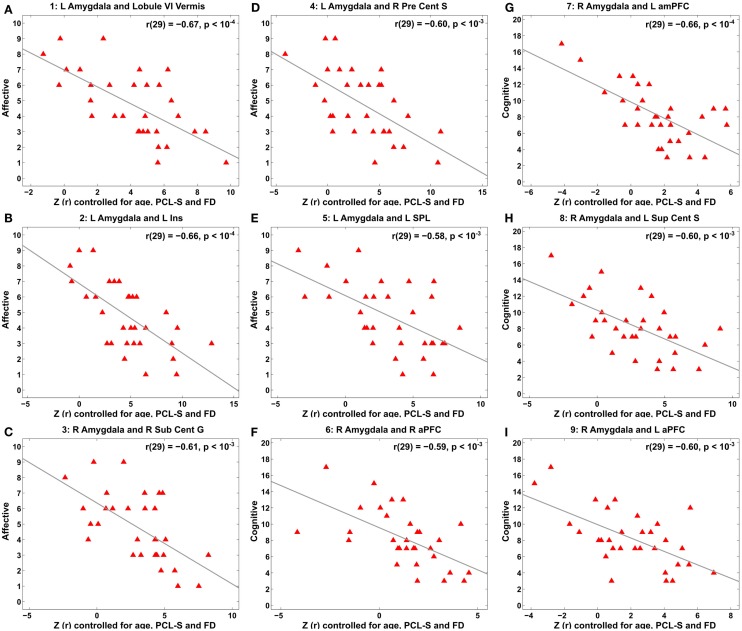
Figure 5.
Scatter plots for correlation between amygdala connectivity and the Buckley BDI factors within the TBI group with depressive symptoms at each of the selected nine local peaks in Figure 4. (A–E) The Affective factor versus left amygdala connectivity in the cerebellar lobule VI vermis (A), left insula (B), right subcentral gyrus (C), right precentral sulcus (D), and left superior parietal lobule (E), respectively. (F–I) The Cognitive factor versus right amygdala connectivity in the right anterior prefrontal cortex (F), left anterior medial prefrontal cortex (G), left superior central sulcus (H), and left anterior prefrontal cortex (I), respectively.

