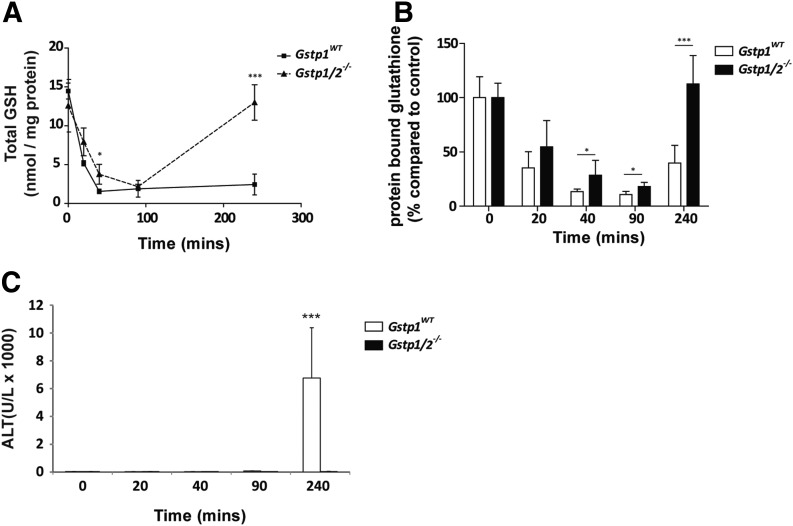
Fig. 3.
Glutathione (GSH) levels and protein S-glutathionylation in Gstp1WT and Gstp1/2−/− mice in response to acetaminophen. Male Gstp1WT and Gstp1/2−/− mice were administered a single oral dose of APAP (300 mg/kg) and harvested at the time points indicated. Livers were removed, washed in PBS, and analyzed for total glutathione levels (A) and total levels of protein S-glutathionylation (B) as detailed in Materials and Methods (n = 8; *P < 0.05; ***P < 0.001). Error bars show the mean ±S.D. (C) Male Gstp1WT and Gstp1/2−/− mice were administered a single oral dose of APAP (300 mg/kg), and cardiac punctures were taken at the time points indicated. Blood samples were collected into heparin tubes and centrifuged at 13,000 rpm for 10 minutes at room temperature, and the plasma was analyzed for ALT content (n = 3, ***P < 0.001). Error bars show the mean ±S.D.

